Archive for the 'visualization' Category

icy and cold

Wednesday, January 6th, 2010

schieberschildIMGP4556450

It has been icy and cold the last days in Berlin with a lot of snow (see above image from today). In an earlier randform post I indicated that there is quite a lot to tell about badly built US houses. Like, when living in New England, it happened one cold day that the dishwasher didnt work. It took us quite a while to find the reason. The reason was that a pipe, which was INSIDE the house, however too close to the outer wall, froze. Yes you understood correctly – the insulation of the house was so sparsely that this pipe froze inside the house!

But back to the image – if you ever wondered what these strange signs on lamp posts and trees in Germany may mean (like the blue sign in the image above which you see if you follow the arrow). These signs are giving a detailled description of hydrants and facilities for water, natural gas, district heat and electricity use. So the above sign in the image should indicate a water gate (SCHIEBER in german). This sign methodology makes it considerably easy to detect frozen and/or broken pipes in the soil. Hopefully there will be a change in the US regarding the saving of energy, otherwise one should may be think about developping a sign methodology for frozen pipes inside US houses…

pixillation

Thursday, September 3rd, 2009


graphics looking as from cellular automata (game of life?) and fluids in a psychadelic 1970 animation by Schwartz and Knowlton.
via dataisnoture

midori vs aoui

Thursday, July 23rd, 2009

aoui450.JPG

Traffic lite in Brietain

Our friend Sophie Molholm coorganized recently a conference in multisensory research. Looking at the conference announcement I felt inspired to ask myself again to what extend rational cognitive instances do influence perception. An example: A traffic light in the western world is usually considered to have the colors red-yellow-green (or at least red and green (although the new LED lights look kind of bluish)). However I think it is important to note that in japaneese the green color for a traffic light – is not “MIDORI” (green), but “AOUI”, which is BLU! Did this make japanese people more prone to call something green-bluish “blue” instead of green? Doing experiments for this example might be difficult due to the ethnic pecularities, but I am sure there exist other examples and probably even studies on that subject.

here a little collection of randform posts related to the subject:

naming-gaming: evolution of languages
wirepullers: artwork challenging salience
manicone: artwork challenging 4 dimensional space perception
focus and context, part I: evolution and knowledge formation
focus and context, part IV: A Physicist Experiments With Cultural Studies: knowledge formation in humanities vs natural sciences
Le manoir du diable: conscientious coloring of astronomical data
common sense: designing computer minds at media lab
canny skinny skin scans perception and quantum computing (see also focus and context, part IIa: A quantum computation game)
error incognito:perception and space
Dreammachine: psychadelic effects in neuroscience
uncanny paintings: link to an experiment using facial expressions as a feedback interface for a painterly rendering algorithm
visualizing meaning: link to a survey concerning the usefulness of diagrams and charts in knowledge building (and a funny comment to that)

Lucifer’s toy lab

Wednesday, July 15th, 2009

deutmus0450.JPG

Last weakend we were doing a visit to the Deutsche Museum.

(more…)

brandform

Sunday, June 21st, 2009

blog450.jpg

The frequent randform visitor knows that randforms main issue is not “popularizing science“.

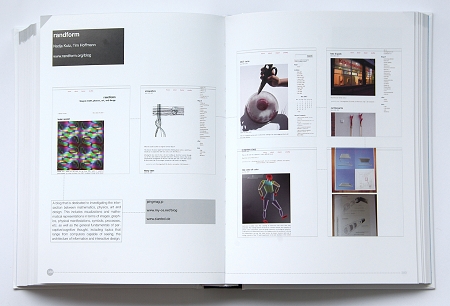
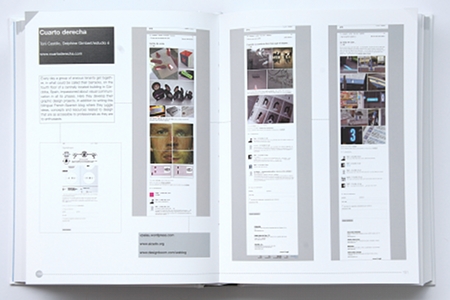
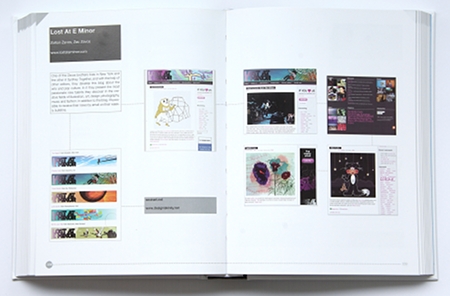
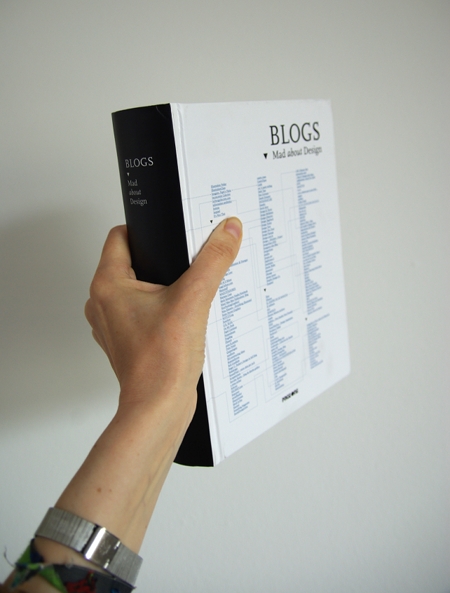
Although we eventually may post an article which could be finally considered as “popular science” (last not least because we like to talk about science in a rather easy understandable way) we are mainly interested in discussing the communicational and perceptional manifestations of science. The visual ways of communication are here of special importance and thus we are especially proud that we were included in a carefully and thoughtfully edited book about blogs that are related to graphic design.

From the book cover:

Blog, weblog, logbook – these are words of our time. Although blogs have existed since the end of the 1990’s, they flourished only in recent years. Weblogs gained its popularity as a medium to tell stories and develop thoughts through dialogue.

With advancement of the Internet technology, creating and publishing a blog is as simple as it is to check your emails. What makes the difference is therefore, outstanding content. Blogs, Mad about design is a collection of the most interesting and exiting blogs that are related to graphic design.

blograndform450.jpg

blogcuartoderecha450.jpg

bloglostateminor450.jpg

Blogs, Mad about design
Mao Mao publications (2009) (blog)
ISBN 978-981-245-715-8

The text about randform in the book:

A blog that is dedicated to investigating the intersection between mathematics, physics, art and design. This includes visualizations and mathematical representations in terms of images, symbols processes, etc. as well as the general fundamentals of perceptive/cognitive thought, including topics that range from computers capable of seeing, to the architecture of information and interactive design.

on amounts

Thursday, June 18th, 2009

scale2.jpg

The area of the above squares shall visualize a certain amount of money.

A little puzzle for randform visitors:

The upper outer square visualizes an amount which is … times bigger as the amount of the upper inner square.

The lower outer square visualizes an amount which is … times bigger as the amount of the lower inner square.

(more…)

scaling facts

Sunday, May 31st, 2009

In a recent post on his blog Terence Tao had the idea to scale the US budget and other data with the scale factor of 3/100 million. In particular the US population of 306.44 million shrinks -if one uses this factor- to about 9 people (306.44million/(100 million/3) =3.0644*3 =(approx) 9 people) which is about one to two average families. He did that in order to facilitate the comparision of the US-budget with a normal one-to-two family household budget.

I found that a useful visualization experiment and thus tried to do the same with the german budget – that is I used a scale factor which scales the population of Germany (originally 82.099 million down to 9, i.e. I used the factor 0.000 000 11 = 11/100 million (82099000*0.00000011 = 9.03..) and multiplied it with the corresponding amount in euro and in US-dollar (since I did this with an online currency calculator on different days there may be some variations). All calculations are without guarantee and I hope mistakes will be pointed out to me in the comment section. I abbreviate the number 1 billion = 10^9=1 000 000 000 with the letter B. So 1 B$ means 1 billion US dollar. Interesting figures are highlighted with an ->.

The revenues and spending in Germany are divided into the federal government (“Bund“) on one hand and the federal states (“Länder“) and districts (“Gemeinden“) on the other hand (here details in german). Both shares are very roughly the same. For example in 2005 the spending was
Bund 294.0 BEuro
Länder 259.3 BEuro and Gemeinden 153.3 BEUro
alltogether: 625.9 Beuro

I found no survey on the federal states and districts, besides this overall Länder and Gemeinden revenues and spending. The federal states are for example in charge for schools, I think they do not pay for military (?). However besides this the federal government budget (“Bund“) gives already quite a good overview over priorities.

I recovered the other data (like GDP etc.) to a great part from the federal office of statistics which hosts confusingly also the statistikportal. The website of this federal office is -mildly put- uncomfortable. That refers not only to the overall webdesign like for example it took me more than quite a while to find detailed readings on the GDP (since I started out at the statistikportal), but also to the overall accessability of data. For example I was also interested wether things like the Abwrackpraemie raise or lower the GDP or wether paying for volunteering could raise the GDP in some way…(just as a trick for the upcoming elections…), however in this GDP document it is even not possible to deduce within a reasonable amount of time which positions are summed over and which are subtracted.

Here some

general data:
  • National population 2008: 82.099 million 9 people
  • Germany Land mass: 357 021 sqkm
  • Germany Land mass/capita : 357 021 million sqm/82. 099 million persons = 4348 sqm
  • US Land mass:9 826 630 sq km
  • US Land mass per capita: 9 826 630 million sqm/306.44 million persons = 32113 sqm
  • But back to the budget discussion. The federal government (“Bund”) budget (Bundeshaushaltsplan) which is as explained above about half of the overall german budget is available as a pdf document here. From it one can read off a lot of the following figures (I tried approximately to reflect the ones Terence Tao chose). If there is no other link provided then the corresponding number in the below list is from this document.

    Example: If the federal government (“bund”) has a budget of 283.200 BEuro for 2008 then this is a scaled budget of 283 200 000 000 Euro * 0.00000011 = 31152 Euro. Since this is as explained above about one half of the overall german budget the state family of 9 has thus an approximate budget of 2*31152 Euro =
    ->(approx) 60 000 Euro (per year).

    That is 2* 383.343 B$=2*383 343 000 000$ which gives a scaled budget of 2*42167 $ =(approx) 84 000 $ (per year) which is in the same range as the US budget of 75 000 $ (per year), which appears in Terence Taos list. Compare these 60 000 Euros to the salary of 500 000 Euros which are not enough for the best.

    German budget numbers rescaled to a family of 9:

    The green number is a real budget number which is rescaled to the budget of a “family of 9 people” in Euro, the blue number gives the same amount in dollar so that it is comparable with the US budget in Terence Taos list.

  • Total revenue (Bundeshaushalt): 283.200 BEuro 42167 s$ 31 152 Euro 42 168 $
  • Total spending: 283.200 BEuro 42167 s$ 31 152 Euro 42 168 $
  • Social Security alltogether (including health insurance, unemployment payments, etc.):140.322 BEuro 189.822 B$ 15 435 Euro 20 880 $
    • Health insurance: 3.692 BEuro 4.993 B$ 406 Euro 549 $
    • Children payments (Kindergeld): 0.3 BEuro 0.41 B$ 33 Euro 45 $
    • Social Security/unemployment payments: 94.313 BEuro 127.614 B$ 10374 Euro 14038 $
    • consequence of war payments: 3.200 BEuro 4.332 B$352 Euro 477 $
  • Health, environment, sports and recreation: 0.998 BEuro
    1.349 B$ 109 Euro 148 $
  • Traffic and Infromation services: 11.149 BEuro 15.077 B$ 1226 Euro 1658 $
    • Autobahn:3.323 BEuro 4.496 BEuro365 Euro 494 $
  • ->Defense: 29.299 BEuro 39.639 B$ 3222 Euro 4360 $
  • Foreign affairs (Auswärtige Angelegenheiten):7.457 BEuro 10.091 B$ 820 Euro 1110 $
  • Education: 13.758 BEuro 18.624 B$ 1513 Euro 2048 $
    • Department of Education: 2008 budget 9.350 BEuro 12.655 B$1028 Euro 1392 $
    • Department of Education: 2009 budget (planned): 10.2 BEuro 14.262 B$ 1122 Euro 1569 $
    • DFG (Deutsche Forschungsgemeinschaft) 0.840 BEuro
      1.136 B$ 92 Euro 125 $
      • Maths & Physical Sciences: ?
        couldn’t find a total number but humanities, natural sciences (i.e. chemistry, physics, math, geosciences), life sciences and engineering hold each about an equal share) so

      • natural sciences approx: 0.210 BEuro 0.284 B$ 23 Euro 31 $
  • ->Debts, Interest payments: 41.855 BEuro 4604 Euro 6200 $
  • Savings: 0
  • Additional spending cuts: ? -> keynote of DFG president addressing potential budget cuts
  • Global War on Terror: ????
  • Energy and Water management: 4.937 BEuro 6.898 B$ 543 Euro

    759 $

    • nuclear energy:0.222 BEuro 0.310 B$ 24 Euro

      34 $

    • ->renewable energies: 0.039 BEuro 0.054 B$ 4 Euro 30 cents

      6 $
      (some additional support for renewables comes in through the Feed-in tarif)

    • mining (mostly subsidies):2.164 BEuro 3.023 B$ 238 Euro

      303 $

      • coal mining: 1.900 BEuro 2.650 B$ 209 Euro 291 $
  • ESA: ?
  • -> economic stimulus’ related to the car industry:
    • Abwrackpraemie (car scrapping bonus) (source) 5 BEuro 7.068 B$ 550 Euro 779 $
    • Opel retrieval (which is without any environmental requirements if I understood correctly):
      • bail: 4.5 BEuro 6.361 B$ 495 Euro 700 $
      • temporary loan: 1.5 BEuro 2.120 B$ 165 Euro 233 $
    • cars and electricity: economic stimulus for electromobility: 0.5 BEuro 0.706 B$ 55 Euro 77 $
      comment: de facto this amounts to a percentual decline in investments in renewable energies, which seems to be an overall trend – the International Energy Agency estimates that

      “for 2009 as a whole investment in renewables could drop by as much as 38%, although stimulus provided by government fiscal packages can probably offset a small proportion of this decline”

  • ->German Financial market stabilization package: 500.000 BEuro 700.000 B$ 55 000 Euro 77 000 $
  • ->Budget deficit:1 564.209 BEuro 2 193.921 B$ 172 063 Euro 241 331 $
  • Multi-Touch for (and through) audio

    Friday, January 2nd, 2009

    An amazing Multi-Touch interface for audio applications by Randy Jones:

    It is actually a master thesis. Here is his project page.

    (via cdm)

    happy new year

    Thursday, January 1st, 2009

    randform wishes a happy new year to everybody!

    just be careful – in particular given the rather bleak economic outlooks it will get even more easy to loose oneself in dreamworlds, so I wouldn’t wonder if the boom of the game industry is going to continue. In this TED video (via serious games) David Perry describes the evolution of video games, however of special interest in this video may be an -what he calls opinion of a student- which is a (realistic?) documentary about a self acclaimed video game addict (second part of the talk, the whole talk is about 20 min). The documentary describes the cognitive changes which are due to excessive video gaming.

    Kaleidoscopes!

    Saturday, December 27th, 2008

    (more…)