What is going on at the Sun?
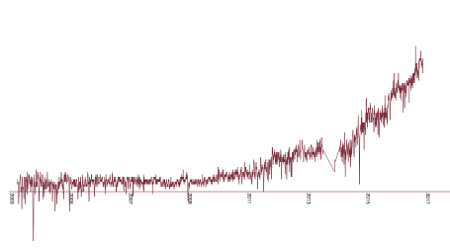
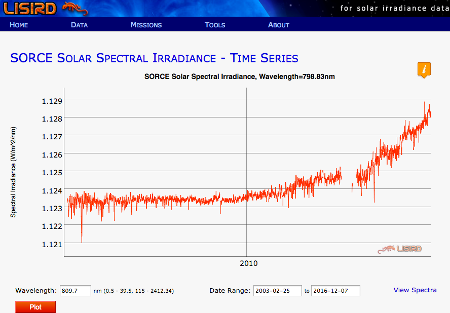
Saturday, February 2nd, 2019In the randform blog post Information about solar irradiance measurements sought, I had posted a visualisation of irradiance data from the Laboratory for Atmospheric and Space Physics (LASP). In the post it was discussed that there could be a rise in irradiance based on the data from their SORCE mission. I think the rise is also somewhat visible in this interactive plot at the Interactive Solar Irradiance Data Center (LISIRD)…that is it is visible until about July 2015. In this post I also posted a picture of the line 774nm, i.e. “red light” which is slightly out of the visible spectrum. The reason was that it seemed that specific line ranges displayed a stronger rise than others (see circles in the other image in this post). Back then I even made some screenshots from the LISIRD visualization, here you can see the close-by line 798.83nm:
Here it is again in my visualization:

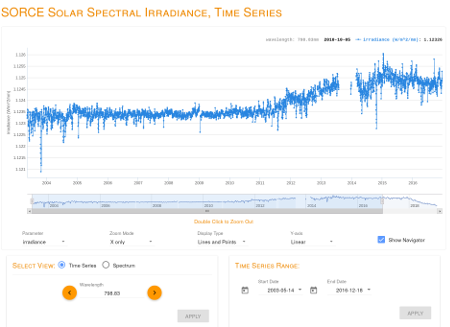
Both visualizations look pretty much the same apart from some visualization effects. But this is how the line in the above time range (here until Dec 18 in 2016) looks as of today in the new LISIRD app:
So things look very differently since about early summer 2015. Is this a correction?
(more…)

