Alert, Nunavut etc.
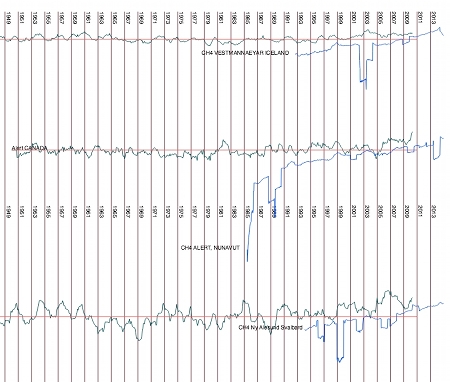
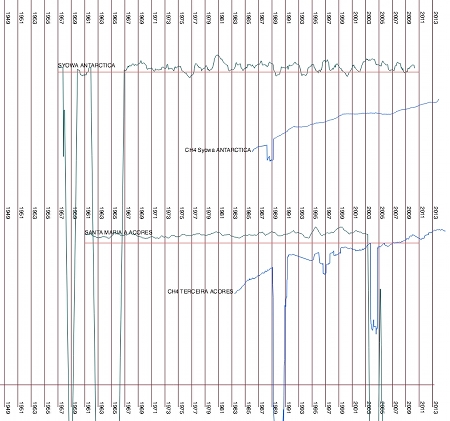
Saturday, November 28th, 2015With some help from Tim and on the occasion of the 2015 United Nations Climate Change Conference I did a visualization which combines local temperatures with methane data. The local temperatures are from the HADCRUT4 file, so they unfortunately stop in 2011. The methane data is from the website of the Earth System Research Lab. Unfortunately there are not so many methane measurements as there should be. In particular very few temperature stations have also made methane measurements, so I improvised a bit and joined some measurement points which are geographically close. The measurements are from Vestmannaeyar, Iceland; Alert Nunavut, Canada; Svalbard, Norway with temperatures from Lufthavn and CH4 from Ny Ålesund; Syowa, Antarctica and from Azores, Portugal, where the temperatures are from Santa Maria Island and the methane data is from Terceira Island (if I interpreted the station names correctly).
I have currently not so much Internet time left, partly because I currently have a job, where I have to sit a lot in front of a computer and partly because I have been trying to improve things in my local surroundings (partially as it seems in vain though) – so no long explanations. I hope you see at least what I see in the images above.
temperature curve: mean of anomalies (monthly deviations of values from monthly mean over measured time period, annual mean of that)
methane curve: annual mean of values

