Archive for 2015

Happy holidays !

Wednesday, December 30th, 2015

randform wishes everybody happy holidays and a good start into the new year!

To stay in the mood some chrismas caroling by pianist Soheil Nasseri at his appartment:

Soheil Nasseri’s youtube channel has of course also some more elaborate music :) -including a video of the performance of the Piano Concerto No. 1 by Rachmaninov at the St. Petersburg Philharmonia which has gotten meanwhile over 300.000 plays.
For those who would like to hear the Piano Concerto live – there is an upcoming performance with the Berliner Symphoniker in the great hall of the Berliner Philharmonie on Sunday Feb 21. at 4 p.m. It might be sold out.

Heiligensee

Monday, December 7th, 2015

Reader Ahmed asked about my ancestors from Heiligensee:

Why is that place where you live called holy lake ?

(more…)

Alert, Nunavut etc.

Saturday, November 28th, 2015

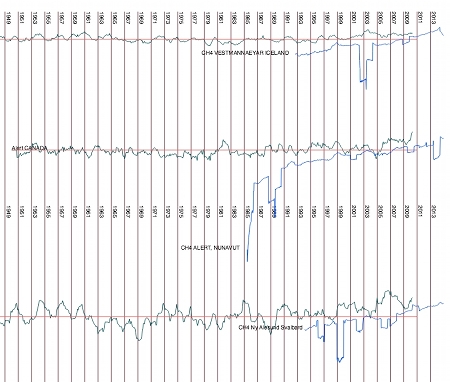
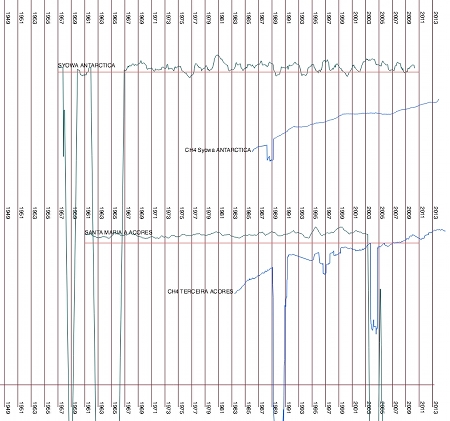
With some help from Tim and on the occasion of the 2015 United Nations Climate Change Conference I did a visualization which combines local temperatures with methane data. The local temperatures are from the HADCRUT4 file, so they unfortunately stop in 2011. The methane data is from the website of the Earth System Research Lab. Unfortunately there are not so many methane measurements as there should be. In particular very few temperature stations have also made methane measurements, so I improvised a bit and joined some measurement points which are geographically close. The measurements are from Vestmannaeyar, Iceland; Alert Nunavut, Canada; Svalbard, Norway with temperatures from Lufthavn and CH4 from Ny Ålesund; Syowa, Antarctica and from Azores, Portugal, where the temperatures are from Santa Maria Island and the methane data is from Terceira Island (if I interpreted the station names correctly).

I have currently not so much Internet time left, partly because I currently have a job, where I have to sit a lot in front of a computer and partly because I have been trying to improve things in my local surroundings (partially as it seems in vain though) – so no long explanations. I hope you see at least what I see in the images above.

temperature curve: mean of anomalies (monthly deviations of values from monthly mean over measured time period, annual mean of that)
methane curve: annual mean of values

Volt ohne Raum

Wednesday, October 21st, 2015


Organic lettuce in Brandenburg

(more…)

Berlin Art Week

Sunday, September 13th, 2015

Acrylic paint on cardboard. 60×70 cm. artwork by Marion Ditzen. Title: “Keine Gähngefahr mehr auf der Artig Week: König Hui und das Ming-Pling-Bling.” Any resemblances to real persons are purely accidental and not the intent of the artist.

I would like to remind you of the Berlin Art Week, which is taking place this week in Berlin:

The fourth Berlin Art Week will be held this year from 15–20 September 2015. For six days, art lovers from all over the world will gather in Berlin.

By the way I hope the above artwork by Marion Ditzen will eventually be donated FOR SALE for supporting a local restoration project here in Marzahn. I might eventually talk about that project later. Please try to convice the artist in the comment section below that the donation for such a project would be a good idea.

refugees and integration

Monday, August 3rd, 2015


veggies at a food discounter in Berlin

veggies in a market in Tangier, Morocco (according to Eurostat 4,255 asylum applicants came to Europe from Morocco in 2014).

(more…)

netzpolitik

Saturday, August 1st, 2015

I am quite shocked to hear that two bloggers from the blog netzpolitik, namely the here already mentioned Markus Beckedahl and the blogger André Meister were accused of treason for reports and the publication of some apparently classified information related to projects connected with a project called after the greek Perseus. The projects have amongst others a component which deals with the mass surveillance of social networks by german intelligence. Treason is to be punished with at least one year in jail if I understood correctly. I briefly read the various reports at netzpolitik (for time reasons in a rather diagonally manner) and I found nothing which could remotely justify such charges in my point of view. That is the presentations there describe a rough organistorial setup in which rather unspecified general tasks, like coordinization, consulting etc. are mentioned. The documents and reports thus give a very sketchy outline about the rough size and – in particular- costs of the projects (which seems to be rather of interest to the tax payer), but nothing really concrete.
The investigation is currently suspended and I hope that the charges will be dropped.

global warming didn’t stop

Saturday, July 11th, 2015

Image from NOAA (public domain if I understood correctly)

Those who follow the randform posts closely know that Tim and me had worked on a visualization of a main collection of global temperature stations. It was used in a post on Azimuth – a blog which is mostly concerned with environmental topics and which is run by the mathematical physicist John Baez. In the post I reviewed the temperature data, which was used by the IPCC for their sofar published climate Assessment Reports up to AR4 in 2007. I left the conclusions about the investigated temperature records and their quality to the reader, but in the comment section I became a bit more “direct” and wrote:

Well every reader may judge him/herself by looking at the visualizations. If you want my opinion: I think this is rather catastrophic. In particular I wouldn’t wonder if the “global warming hiatus” is connected to the gaps.

The “global warming hiatus” or “global warming pause” is a finding that the global temperature rise has approximately paused since 1998 and hence by making this comment I questioned this “warming pause” or at least its shape. Unfortunately my suspicion has now been more or less confirmed. That is there global warming continues.

The article “Possible artifacts of data biases in the recent global surface warming hiatus” by Karl et al. Science 2015 0 (2015)” in the journal “Science” has unfortunately to be rented for the prize of 20$/day for reading (so I haven’t looked at it), but NOAA has a summary, where it is written:

“Adding in the last two years of global surface temperature data and other improvements in the quality of the observed record provide evidence that contradict the notion of a hiatus in recent global warming trends,” said Thomas R. Karl, L.H.D., Director, NOAA’s National Centers for Environmental Information. “Our new analysis suggests that the apparent hiatus may have been largely the result of limitations in past datasets, and that the rate of warming over the first 15 years of this century has, in fact, been as fast or faster than that seen over the last half of the 20th century.”

About the newly included datasets it is written:

New analyses with these data demonstrate that incomplete spatial coverage also led to underestimates of the true global temperature change previously reported in the 2013 IPCC report. The integration of dozens of data sets has improved spatial coverage over many areas, including the Arctic, where temperatures have been rapidly increasing in recent decades. For example, the release of the International Surface Temperature Initiative databank, integrated with NOAA’s Global Historical Climatology Network-Daily dataset and forty additional historical data sources, has more than doubled the number of weather stations available for analysis.

I mentioned the International Surface Temperature Initiative (ISTI) in the Azimuth blogpost together with a citation from their blog:

The ISTI dataset is not quality controlled, so, after re-reading section 3.3 of Lawrimore et al 2011, I implemented an extremely simple quality control scheme, MADQC.

which doesn’t sound too great, if it comes to quality assessment.

But still: I suspect that the new temperature curves of that article match the real temperatures to a much better degree than the ones which were used for the IPCC reports until 2013.
It is though unfortunate that these new temperatures are not available, because I still have that suspicion that the role of methane in that warming trend is greatly underestimated and I still think it IS ULTIMATELY URGENT to investigate that suspicion. The exact shape of the curve would be rather important, because amongst others there was also a “hiatus” in the rise of methane and I think you can see that short pause in the above image.

Methane may however play eventually also a role in a way more dramatic environmental context. In my point of view that context should also be investigated URGENTLY, but it seems the view of methane is viewed controversely among climate scientists, at least Gavin Schmidt of the NASA’s Goddard Institute for Space Studies blurrily expressed anti-alarmistic words in an interview with John H. Richardson from Esquire (Esquire link via John Baez) by saying that:

“The methane thing is actually something I work on a lot, and most of the headlines are crap. There’s no actual evidence that anything dramatically different is going on in the Arctic, other than the fact that it’s melting pretty much everywhere.”
Modische Maschen aus Marzahn-Hellersdorf

Wednesday, June 10th, 2015

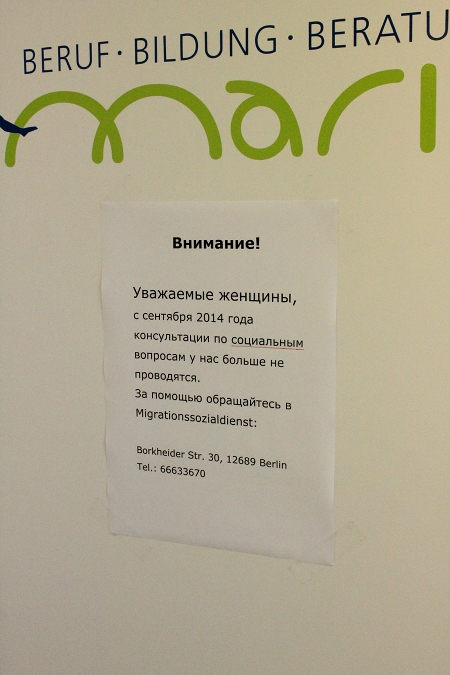
Announcement on the door of Marie e.V.

(more…)

übergeben

Thursday, May 28th, 2015


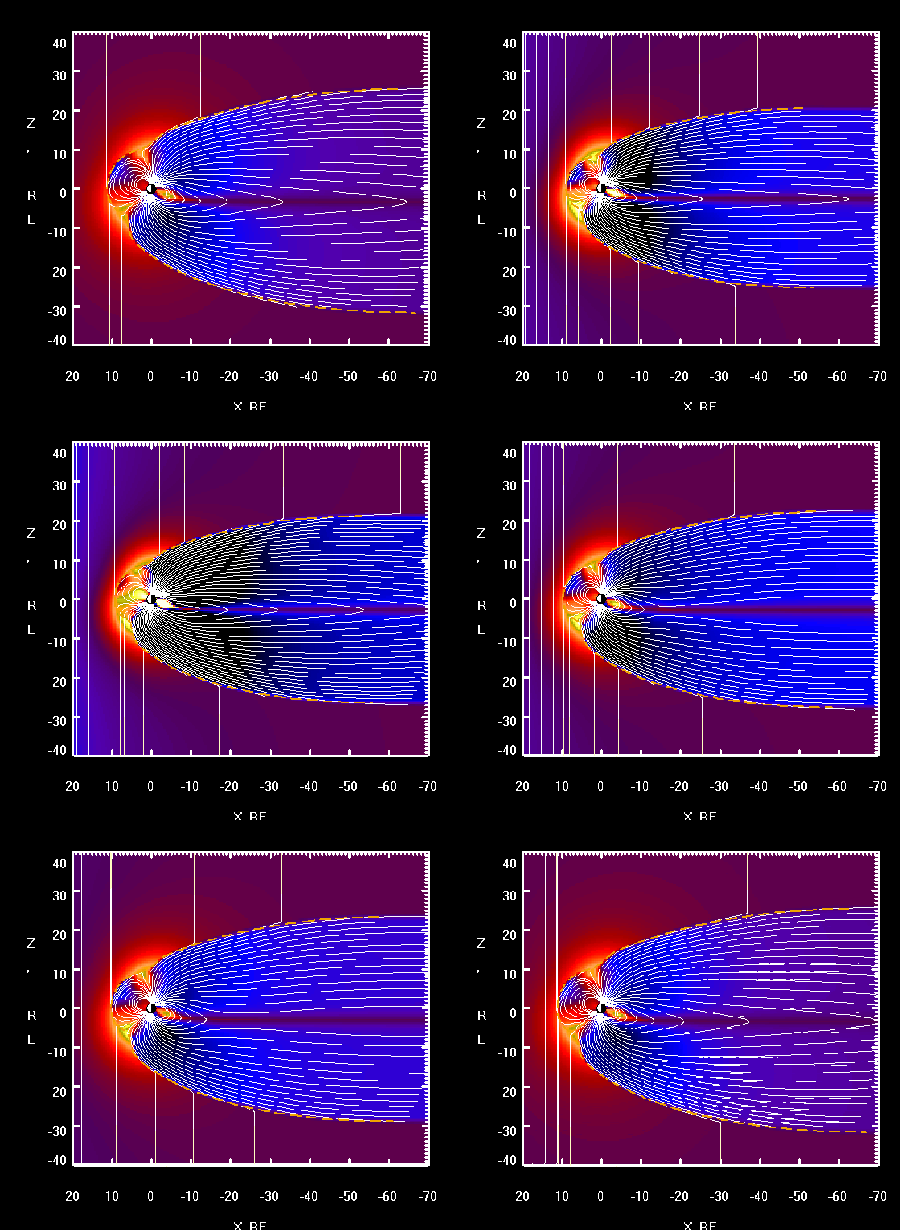
Simulation of Earth’s magnetic field in interaction with (solar) Interplanetary_magnetic_field.
Image public domain from Wikipedia by Nikolai Tsyganenko, USRA/NASA/GSFC.

(more…)