Enigame 2020_2
Monday, September 7th, 2020Tim had just finished the new trailer for Enigame 2020_2, which will -like the last puzzle hunt- be online only.
Trailer 1 and Trailer 2 are on youtube.
randformblog on math, physics, art, and design |
Tim had just finished the new trailer for Enigame 2020_2, which will -like the last puzzle hunt- be online only.
Trailer 1 and Trailer 2 are on youtube.
In case someone tries to contact me via facebook, like in particular from the fashion hackdays group: my facebook account https://www.facebook.com/nadja.kutz.1 was deactivated, because it was probably hacked via a phishing attack. Reactivation seems only possible by uploading personal documents, which I won’t.
Welcome to Enigame Quarantine Edition!
In the randform blog post Information about solar irradiance measurements sought, I had posted a visualisation of irradiance data from the Laboratory for Atmospheric and Space Physics (LASP). In the post it was discussed that there could be a rise in irradiance based on the data from their SORCE mission. I think the rise is also somewhat visible in this interactive plot at the Interactive Solar Irradiance Data Center (LISIRD)…that is it is visible until about July 2015. In this post I also posted a picture of the line 774nm, i.e. “red light” which is slightly out of the visible spectrum. The reason was that it seemed that specific line ranges displayed a stronger rise than others (see circles in the other image in this post). Back then I even made some screenshots from the LISIRD visualization, here you can see the close-by line 798.83nm:
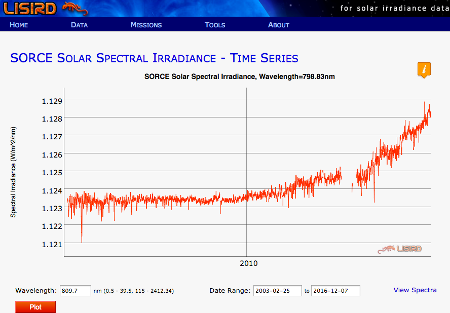
Here it is again in my visualization:
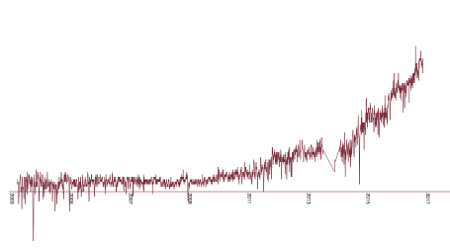
Both visualizations look pretty much the same apart from some visualization effects. But this is how the line in the above time range (here until Dec 18 in 2016) looks as of today in the new LISIRD app:
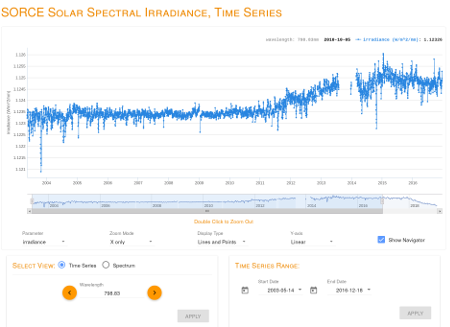
So things look very differently since about early summer 2015. Is this a correction?
(more…)
Randform sends season’s greetings and a happy new year.
This month no randform post.
No post in march 2018. Mostly due to medical incidents.
Mohammad Ali (mohdali) had made a nice illustration of the socalled rolling shutter effect. He wrote a programm in javascript which uses the library d3 called Rolling shutter.
This program was used by artist Scriptique to program a kind of “paint-by-number recreational occupation for your browser” (as the artist called it). It should display something like “a paint drop dropping”.
The program has a MIT licence and you can see how well your browser paints by numbers by pasting the program into a file and then opening the file in your browser (tested with firefox).