SPACED OUT
Thursday, August 19th, 2021
Tim has made a new trailer for the Enigame 2021_2 puzzle hunt this fall – the spaced out edition.
randformblog on math, physics, art, and design |
Tim has made a new trailer for the Enigame 2021_2 puzzle hunt this fall – the spaced out edition.
Rotatable with your mouse after you click on “Read the rest of this entry“.
Most of randform readers might have heard that the socalled greenhouse effect is one of the main causes of global warming.
The effect is not easy to understand. There are two posts which give a nice intro to the greenhouse effect on Azimuth. One is by Tim van Beek and one is by John Baez.
The greenhouse effect can also be understood in a slightly more quantitative way by looking at an idealized greenhouse model.
In the above diagram I now enhanced this idealized greenhouse model (as of Jan 2017) in order to get an idea about the hypothetical size of the effect of an absorption of non-infrared sunlight and it’s reradiation as infrared light, i.e. the possibly effect size of a certain type of fluorescence.
I sort of felt forced to do this, because at the time of writing (February 2017) the current climate models did not take the absorption of UV and near infrared light in methane (here a possible candidate for that above mentioned hypothetical greenhouse gas) into account and I wanted to get an insight into how important such an omission might be. The simple model here is far from any realistic scenario – in particular no specific absorption lines but just the feature of absorption and reradiation is looked at.
—————————————————————————–
insert April 24, 2023
My first email asking about the inclusion of shortwave (UV and near infrared) radiation into the radiative forcing of methane to Gunnar Myrhe was on Sept. 10, 2015. The last answer I got was in January 2017, when I pointed out in a new email that there are problems with the evaluation of solar radiation, as explained in the randform post Information about solar irradiance measurements sought (see also What is going on at the Sun?). The answer was basically that he is busy with meetings etc.
Meanwhile I had found out, by searching the internet, that the problems had been somewhat adressed.
That is in: Radiative forcing of carbon dioxide, methane, and nitrous oxide: A significant revision of the methane radiative forcing by M. Etminan1 , G. Myhre2 , E. J. Highwood 1 , and K. P. Shine it was found that
Methane’s RF is particularly impacted because of the inclusion of the shortwave forcing; the 1750–2011 RF is about 25% higher (increasing from
0.48Wm−2 to 0.61Wm−2) compared to the value in the Intergovernmental Panel on Climate Change (IPCC) 2013 assessment; the 100year global warming potential is 14% higher than the IPCC value.
The new value came from the inclusion of absorption spectra with shorter wavelengths.
The new value was inserted into climate simulations in:
Understanding Rapid Adjustments to Diverse Forcing Agents
Accordingly the new IPCC report writes in chapter 7: 7.3.2.2 Methane:
The SARF for methane (CH4) has been substantially increased due to updates to spectroscopic data and inclusion of shortwave absorption (Etminan et al., 2016). Adjustments have been calculated in nine climate models by Smith et al. (2018b). Since CH4 is found to absorb in the shortwave near infrared, only adjustments from those models including this absorption are taken into account. For these models the adjustments act to reduce the ERF because the shortwave absorption leads to tropospheric heating and reductions in upper tropospheric cloud amounts. The adjustment is –14% ± 15%, which counteracts much of the increase in SARF identified by Etminan et al. (2016). Modak et al. (2018) also found negative forcing adjustments from a methane perturbation including shortwave absorption in the NCAR CAM5 model, in agreement with the above assessment. The uncertainty in the shortwave component leads to a higher radiative modelling uncertainty (14%) than for CO2 (Etminan et al., 2016). When combined with the uncertainty in the adjustment, this gives an overall uncertainty of ±20%. There is high confidence in the spectroscopic revision but only medium confidence in the adjustment modification.
A very new evaluation in Methane’s Solar Radiative Forcing finds:
Including the impact of SW absorption on stratospheric temperature increases tropopause SARF by 0.039 W m−2 (or 7%) compared to the LW-only SARF.
The article Understanding Rapid Adjustments to Diverse Forcing Agents however also evaluated what a 2% increase of the solar constant parameter shows in the climate models and found (see Fig. 1) that the radiative forcing increases as if one would double the CO2 parameter or triple the CH4 parameter.
—————————————————————————–
The above diagramm shows the earth temperature in Kelvin as a function of two parameters, as given by this enhanced model. The two parameters can be seen as being (somewhat) proportional to densities of a hypothetical greenhouse gas, which would display this type of fluorescence. That is the parameter x is seen as (somewhat) proportional to the density of that hypothetical greenhouse gas within the atmossphere, while y is (somewhat) proportional to the density near the surface of the earth. Why I wrote “somewhat” in brackets is explained below.
The middle of the “plate” is at x=0, y=0 (please hover over the diagram) which is the “realistic” case of the idealized greenhouse model, i.e. the case where infrared absoptivity is 0.78 and the reflectivity of the earth is 0.3. The main point of this visualization is that linearily increasing x and y in the same way leads to an increase of the temperature. Or in other words, although raising x by a certain amount leads to cooling this effect is easily trumped by raising y by the same amount.
As far as I learned from discussions with climate scientists the omission of non-infrared radiation in the climate models was mostly motivated by the fact that an abpsorption of non-infrared is mostly happening in the upper atmossphere (because methane is quickly rising (but there are also circulations)) and thus leading rather to a global cooling effect than a global warming effect and so it in particular doesn’t contribute to global warming. The enhanced simple model here thus confirms that if absorption is taking place in the upper athmossphere then this leads to cooling. The enhanced model however also displays that the contribution of methane that has not risen, i.e. methane that is close to the earth surface, is to warm upon absorption of non-infrared light and that the effect of warming is much stronger than the cooling effect in the upper athmosphere. Unfortunately I can’t say how much stronger for a given amount of methane, since for assessing this one would need to know more about the actual densities (see also discussion below and the comment about circulations). Nonetheless this is a quite disquieting observation.
I had actually exchanged a couple of emails with Gunnar Myrhe, the lead author of this corresponding chapter in the IPCC report, who confirmed that non-infrared light absorption in methane hasn’t sofar been taken into account, but that some people intended to work on the near-infrared absorption. He didn’t know about the UV absorption that I had found e.g. here (unfortunately my email to Keller-Rudek and Moortgat from 2015 whether there is more data for methane especially in the range 170nm-750nm stayed unanswered) and thanked for pointing it out to him. He appeared to be very busy and as drowning in (a lot of administrative) work, so that I fear that those absorption lines still might not have been looked at. That is also why I decided to publish this now. I sent a copy of this post to Gunnar Myrhe, Zong-Liang Yang and John Baez in June 2017, where I pointed out that:
I have strong concerns that the estimations of the global warming potential of methane need to be better assessed and that the new value might eventually be very different then the current one.
– but I got no answer.
pan and zoom as usual
In 2006 Tim played around with swarm simulations in processing and ended up with funny flush like settings. We tweaked the parameters in such a way that it ended up looking like and sounding like a galaxy being flushed down the drain and made it into the art work “dipper galaxy flush” where dipper refers to the wellknown patterns in the constellation Ursa Major. Our comment wasn’t though referring to a particular galaxy there but to galaxies in general – which could include our own.
If you look at the processing code you see that Tim’s simulation doesn’t use e.g. Newtonian gravity, although Tim used a force which is similarily “centralizing” as dark matter.
Inspired by discussions about dark matter and dark energy and general relativity at John Baez’ social media I wanted to get a feeling of how important the feature of dark matter is in order to allow for galaxy formation.
The above is a realtime javascript simulation using purely newtonian gravity with no dark matter but two giant masses (indicated by blue circles, which size is not proportional to the smaller circles) and something that could be called an “inelastic binding”. That is if the distance between masses is smaller than some number then those “close-by” masses behave as if they stuck together as in an inelastic collision, or in other words: the velocity of a mass is set to be the weighted average velocity of the close-by masses (details in the code, how much inelastic collision you want is set by the parameter “mix”).
It was acutally not so easy to find a configuration which somewhat mimicks galaxies, but the above looks a bit as if, I find. If I find the time I may add a 3D viewer. Try yourself – the source code is open.
Here how a scientifically advanced galaxy simulation, which includes dark matter looks on a super computer: World’s first realistic simulation of the formation of the Milky Way and here an interview with the author Lucio Mayer. Just like us many other users think it looks like a filmed flush – if you read the comments.
Here another simulation by Fabio Governato on his youtube channel: The Formation of a Milky Way like Galaxy. He has a whole variety of galaxy formation videos.
remark: the simulation is a modification of Mike Bostocks canvas swarm simulation at https://bl.ocks.org/mbostock/2647922
update 1.12.2017: There was a mistake in the addition of the z-speed, which is now corrected in the above version. Luckily the correction did affect the overall appearance only slightly.

In an earlier randform post I mentioned the connection of methane emissions and geological features. In particular in an area called Vestnesa which is about northwest of Svalbard (look at image 3) high methane emissions were due to plate tectonics. In that post I asked wether this fault couldn’t be eventually part of a plate which arises from a break of the Eurasian plate, i.e. in particular whether there are similar plate tectonical ongoings along the (northern part of) Ural. I was in part drawn to that question because of the above image. In the above image you see a plume (CH4 air masses) starting at the Kara sea and then going down south in the west of a line, which seems to indicate the Ob river. I.e. this plume seems to be going down at least along the northern part of the Ural mountains. The image is on a world scale so this is a bit speculative, but still, it looks as if. But since the resolution is so crude it should also be mentioned that east of the Ob there are major gas fields, like at Novy Urengoy.
(more…)
In the randform post “Gesture steered Turing machine” I used data gloves, which were made following the instructions of Hannah Perner-Wilson who is a member of the gloves project. Being weary of sitting too much at the computer I had also written in this post that I would like to make more use of body movements and in particular include danse-like movements in computer interaction and in particular in programming.
Unfortunately rather shortly after I had written the post a not so nice medical indication in my vicinity which was -at least partially- due to too much computer sitting urged me to more or less dramatically speed up this project.
The gesture recognition for my gloves, which were used in the Turing machine example, works, but it is not yet fine grained and exhaustive enough. So I had to look for an easy and fast and at least to some extend workable and affordable solution which would insure a more direct and precise steering possibility, like some version of key gloves. To make it short: In the end I made my own version with Tims help. Again it’s only a start but still.

Sandhauser Strasse in Heiligensee next to the old riflemans house
In the randform post Heiligensee I hypothesized that an ancient oral tradition from the village of Heiligensee might indicate that cults of the germanic goddess Nerthus could have taken place there. I am fully aware that this is super speculative and in particular that it is outrageously unlikely that there is an oral tradition in Berlin which is 1500-to 4000 years old (thats approx. when the semnones lived there). It would not be too far fetched to assume that the tales of Nerthus were converted into tales matching the surroundings of Heiligensee. Nevertheless it should be reminded of that there are oral traditions which lastet for rather long time like the vedas (with by the way interesting error correcting schemes).
Anyways for me the the oral tradition was so compelling close to the Nerthus tales and to the fact that there might have been an ancient sacred location that I was motivated enough to travel to the other side of Berlin and to look for something like a sacred grove, a thing location on a raised mound and/or even a tumulus like in Old Uppsala. That is I looked at the hills across from Sandhauserstr.99 which are called Schifferberge. It should be said that in this area dune hills are rather common, so that when I started out I was quite convinced that the option tumulus was rather a joke. That is I was convinced that the Schifferberge are just dunes instead of containing a tumulus, but I am not so sure anmore. But see the images.
A new astlab project, which comes closer to realize something which I have carried around in my head for now almost ten years.
Tim and me are currently working on a interactive browser visualization using temperature data from HADCRUT, namely the CRUTEM 4 temperature station data which we map with the help of the open source web GL earth API (which seems to be to quite some extend the work of the Czech-Swiss company Klokan technologies) onto a model of the earth (covered with open street maps).
The visualization is still work in progress, but what is already visible is that the temperature data is quite deteriorating (please see also the previous randform post on the topic of deteriorization of data). Where it looks as if the deterioration had been bigger in the years from 2000-2009 than in the years 1980-2000. Below you can see screenshots of various regions of the world for the month of January for the years 1980, 2000 and 2009. The color of a rectangle indicates the (monthly) temperature value for the respective station (the station is represented by a rectangle around its coordinates) which is encoded with the usual hue encoding (blue is cold, red is hot). Black rectangles are invalid data. The CRUTEM 4 data file contains the data of 4634 stations. Mapping all the station data makes the visualization very slow, especially for scaling, therefore the slightly different scalings/views for each region and the fact that screenshots are on display. The interactive application will probably be not for all stations at once.
North America:

Jan 1980

Jan 2000

Jan 2009
Africa:

Jan 1980

Jan 2000

Jan 2009
Asia:

Jan 1980

Jan 2000

Jan 2009
Eurasia/Northern Africa:

Jan 1980

Jan 2000

Jan 2009
Northpole:

Jan 1980

Jan 2000

Jan 2009
update June 15, 2019:
There is now a similar interactive visualization at NASA for the GHCN data set at https://data.giss.nasa.gov/gistemp/stdata/
update December 29, 2021:
The link to our interactive temperature visualization, which was announced above in the post is here, the corresponding post about it is here.
The GHCN page linked on June 15, 2019 doesn’t show any station data anymore:
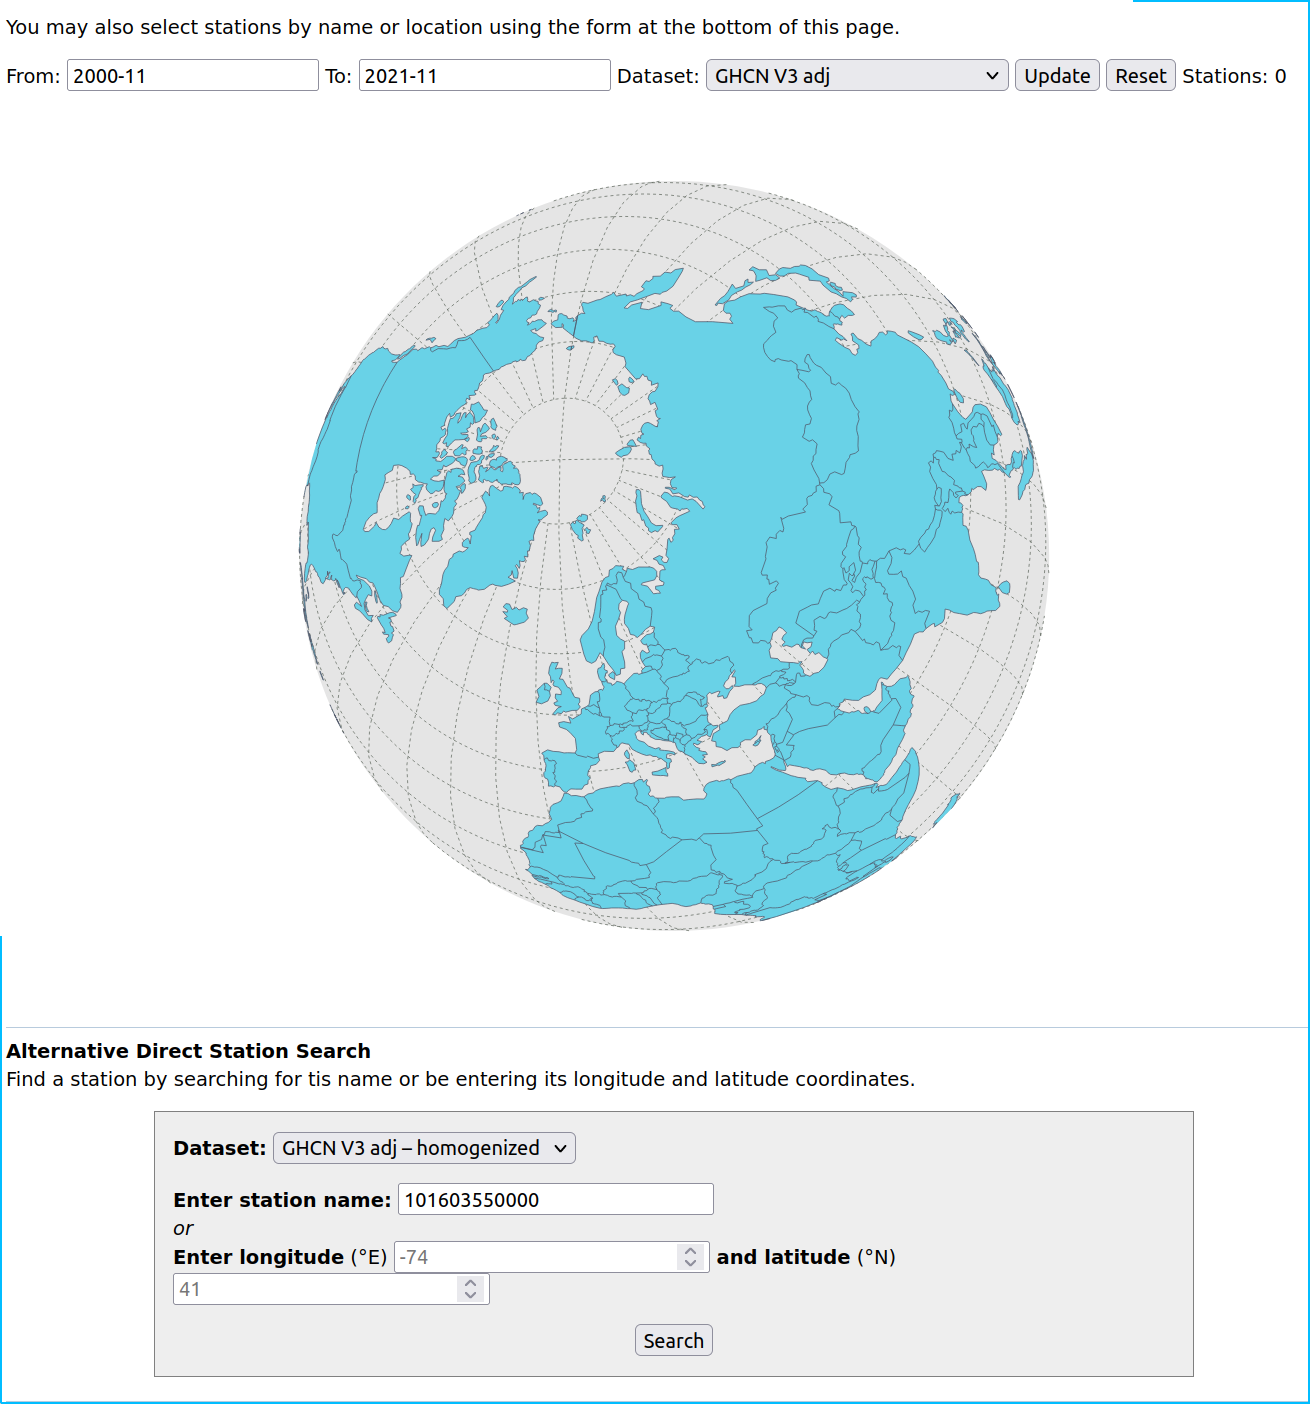
There is currently a new page with a “version 4 dataset” here. This is how it currently looks like:
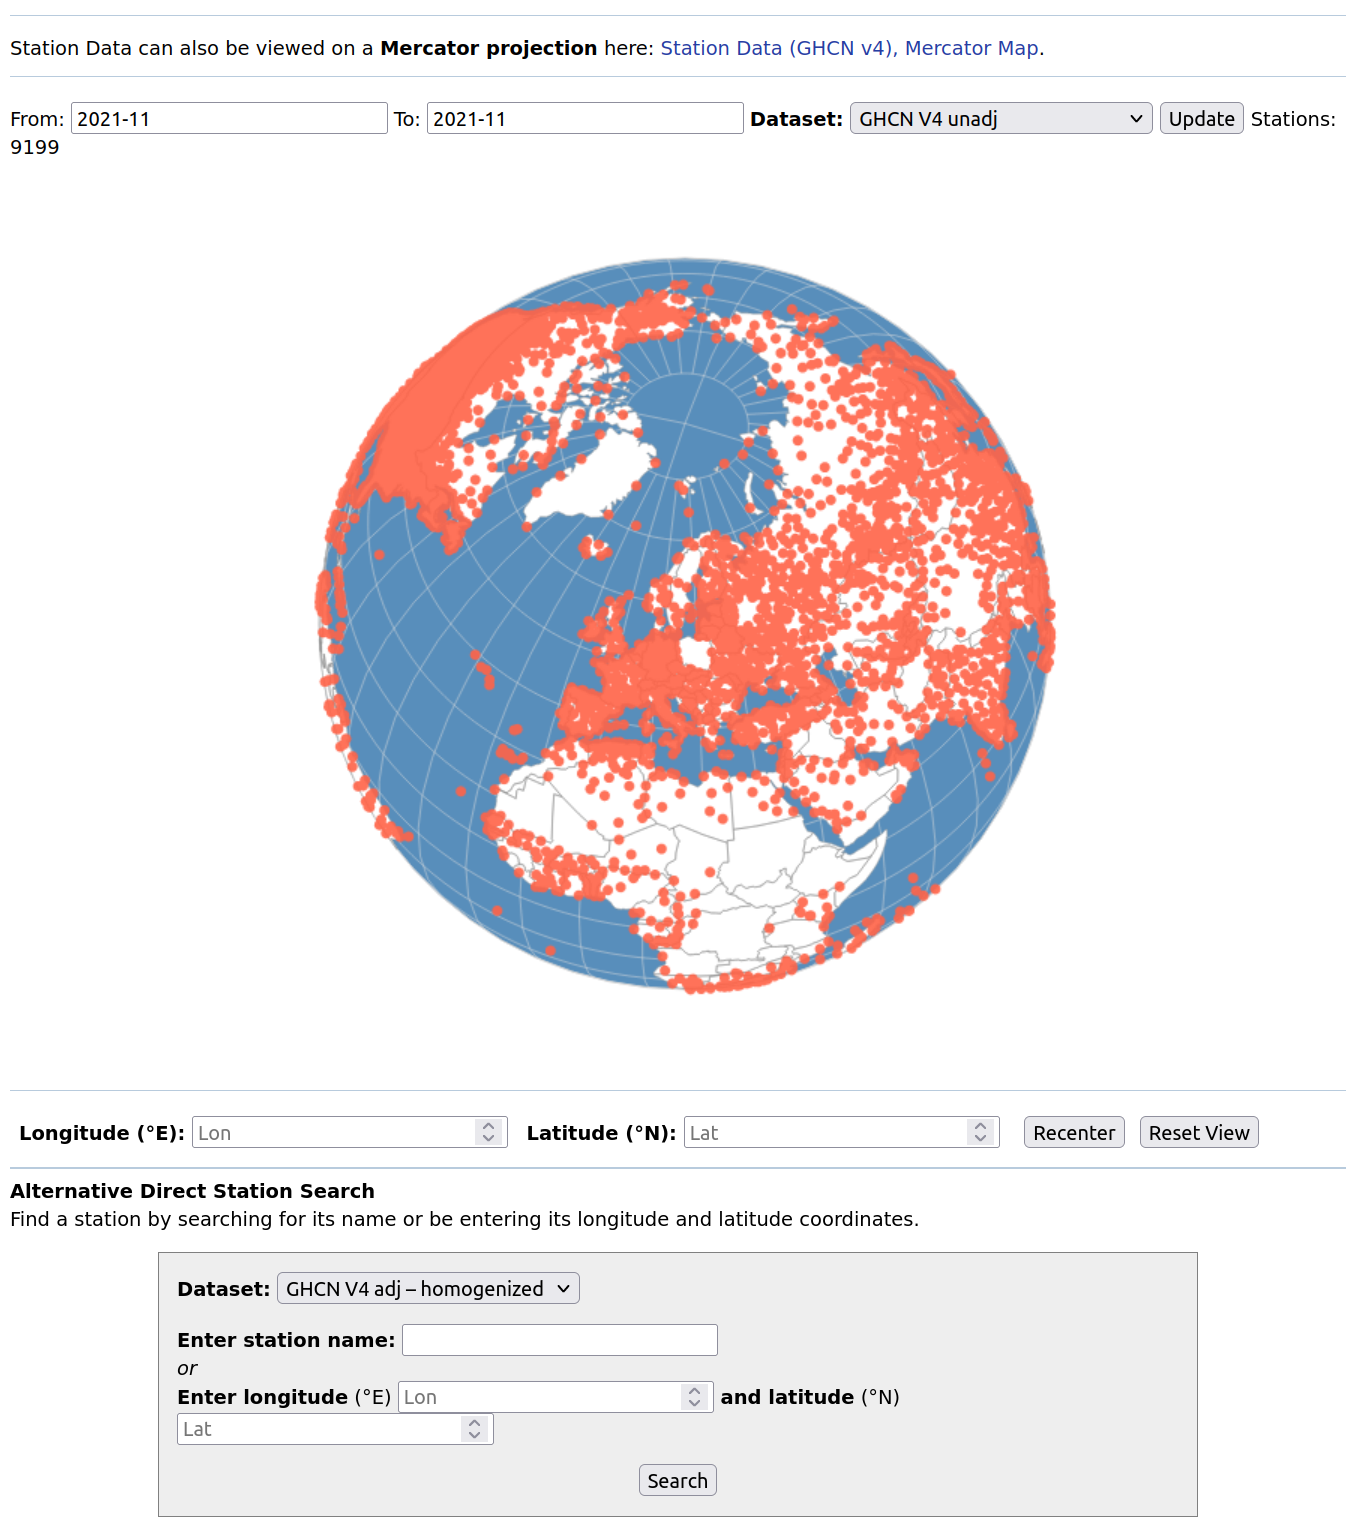
Apriori this looks as if most of the stations are “back on track” but then I couldn’t find out within a decent time how much of this data is “reconstructed” in the sense of “educated guess” and how much is actual data from the respective stations. Another thing that caught my attention was that the content of the tooltipmenu of each station is partially non accessible, I don’t remember whether this is a new phenomenon.

Title: “Kreative Mode beim Bedrockabgrundste-in”, oil on canvas, artist: Mudda Prahler
There was recently a post on Gamasutra with the title: Titanfall: Why Respawn is punishing cheaters. The computer game Titanfall is a First person shooter that can be played with a couple of people in one environment. Wikipedia describes it as follows:
Players fight either on foot as free-running “Pilots” or inside agile mech-style walkers called “Titans” to complete team-based objectives[2][3] on a derelict and war-torn planet[4] as either the Interstellar Manufacturing Corporation (IMC) or the Militia.[5]
I don’t know Titanfall (In general I have been playing first person shooters rather rarely) but what apparently happened was that there where too many people cheating in the game.
In the post it isn’t really described what exactly is implied by cheating, but what I refer from the “punishment” announcement, I think what was happening was that some people used game bots and in particular socalled aimbots, which are software solutions which make shooting easier in such a game. From the Titanfall announcement:
You can play with other banned players in something that will resemble the Wimbledon of aimbot contests. Hopefully the aimbot cheat you paid for really is the best, or these all-cheater matches could be frustrating for you. Good luck.
I was asking myself though wether this action is part of some viral marketing campaign. That is that some cheaters could think that it could be way cooler to “win the Wimbledon of aimbot contests” rather than the usual game. Given that Titanfall had however performance problems which as it seems where due to overloaded game servers and connections, it doesn’t though look as if this would improve with aimbot contests.
In this context:
In a citation about a report by a tech- and investment-advisory firm in the time article: The Surprisingly Large Energy Footprint of the Digital Economy
In his report, Mills estimates that the ICT system now uses 1,500 terawatt-hours of power per year. That’s about 10% of the world’s total electricity generation
The New York times article: Power, Pollution and the Internet remarks the following about e.g. US data centers:
Nationwide, data centers used about 76 billion kilowatt-hours in 2010, or roughly 2 percent of all electricity used in the country that year, based on an analysis by Jonathan G. Koomey, a research fellow at Stanford University who has been studying data center energy use for more than a decade. DatacenterDynamics, a London-based firm, derived similar figures.
A summary of the last IPCC report about climate change and global warming.
and:
In Berlin there is currently the International games week Berlin.
A sort of brief follow-up to the last two posts about simulations. Here a link to Tim’s simulation of a critter under the couch.