Archive for the 'climate' Category

On the deterioration of data

Thursday, August 21st, 2014

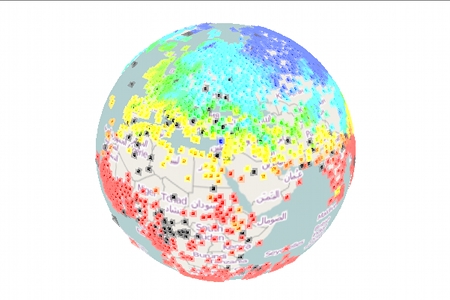
Tim and me are currently working on a interactive browser visualization using temperature data from HADCRUT, namely the CRUTEM 4 temperature station data which we map with the help of the open source web GL earth API (which seems to be to quite some extend the work of the Czech-Swiss company Klokan technologies) onto a model of the earth (covered with open street maps).
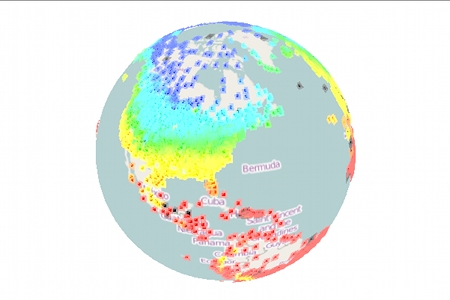
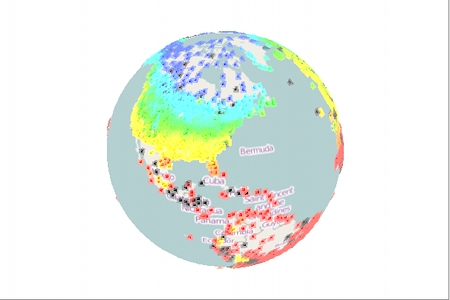
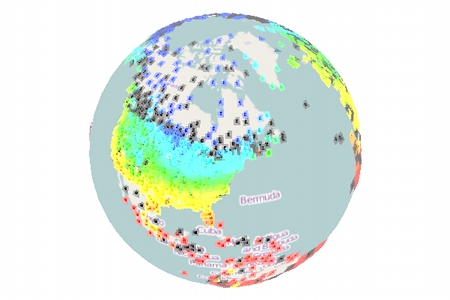
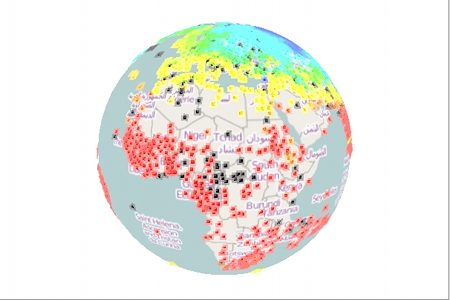
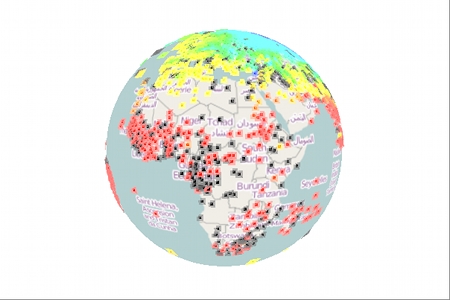
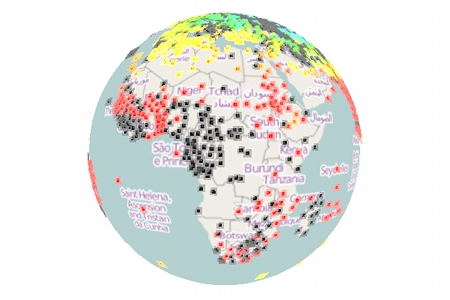
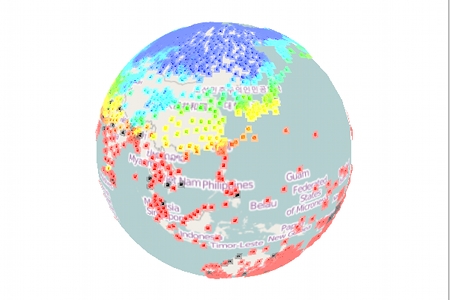
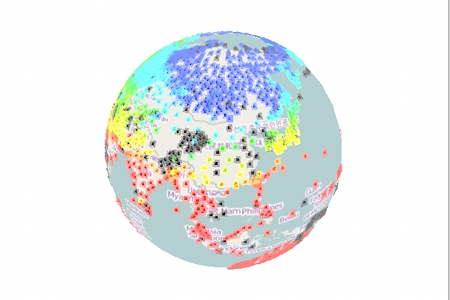
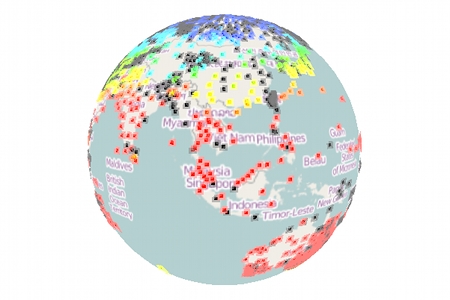
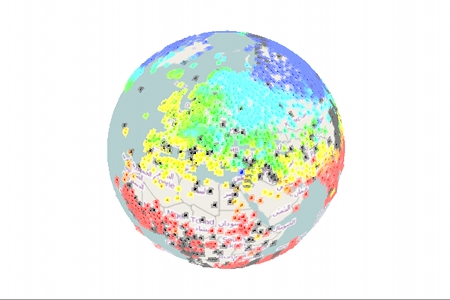
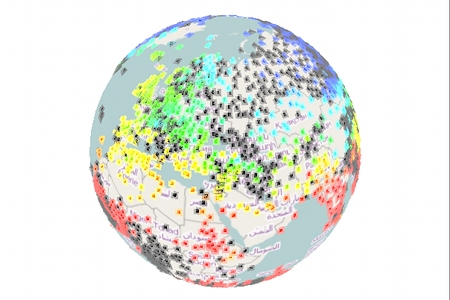
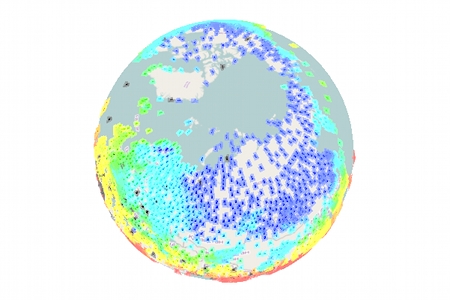
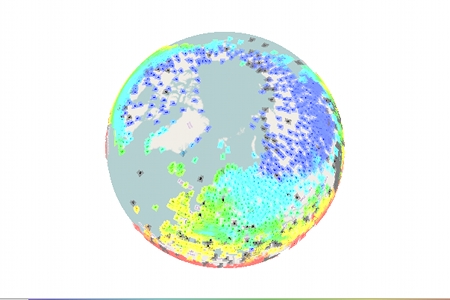
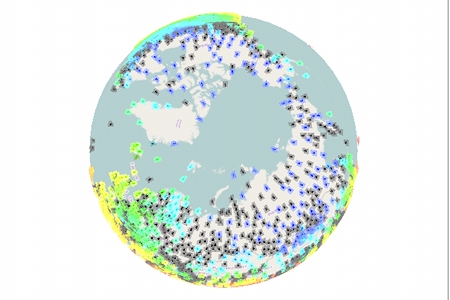
The visualization is still work in progress, but what is already visible is that the temperature data is quite deteriorating (please see also the previous randform post on the topic of deteriorization of data). Where it looks as if the deterioration had been bigger in the years from 2000-2009 than in the years 1980-2000. Below you can see screenshots of various regions of the world for the month of January for the years 1980, 2000 and 2009. The color of a rectangle indicates the (monthly) temperature value for the respective station (the station is represented by a rectangle around its coordinates) which is encoded with the usual hue encoding (blue is cold, red is hot). Black rectangles are invalid data. The CRUTEM 4 data file contains the data of 4634 stations. Mapping all the station data makes the visualization very slow, especially for scaling, therefore the slightly different scalings/views for each region and the fact that screenshots are on display. The interactive application will probably be not for all stations at once.

North America:


Jan 1980


Jan 2000


Jan 2009

Africa:


Jan 1980


Jan 2000


Jan 2009

Asia:


Jan 1980


Jan 2000


Jan 2009

Eurasia/Northern Africa:


Jan 1980


Jan 2000


Jan 2009

Northpole:


Jan 1980


Jan 2000


Jan 2009

update June 15, 2019:
There is now a similar interactive visualization at NASA for the GHCN data set at https://data.giss.nasa.gov/gistemp/stdata/

update December 29, 2021:
The link to our interactive temperature visualization, which was announced above in the post is here, the corresponding post about it is here.

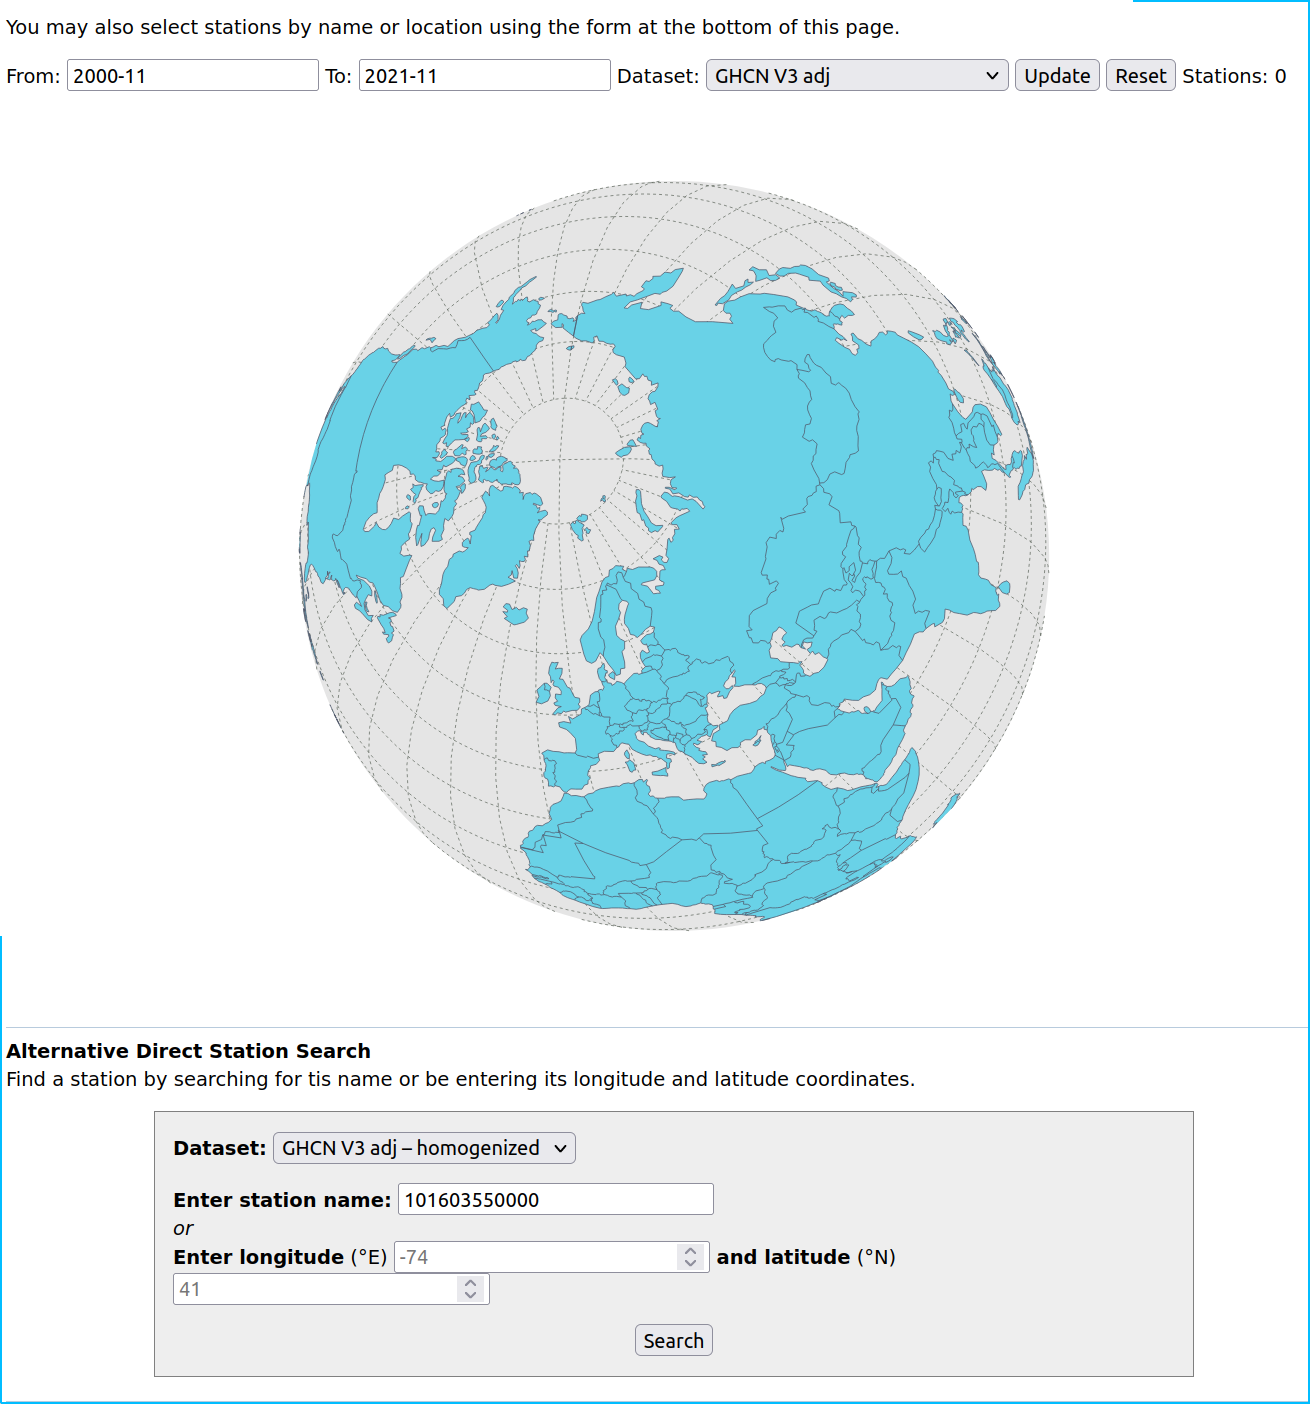
The GHCN page linked on June 15, 2019 doesn’t show any station data anymore:

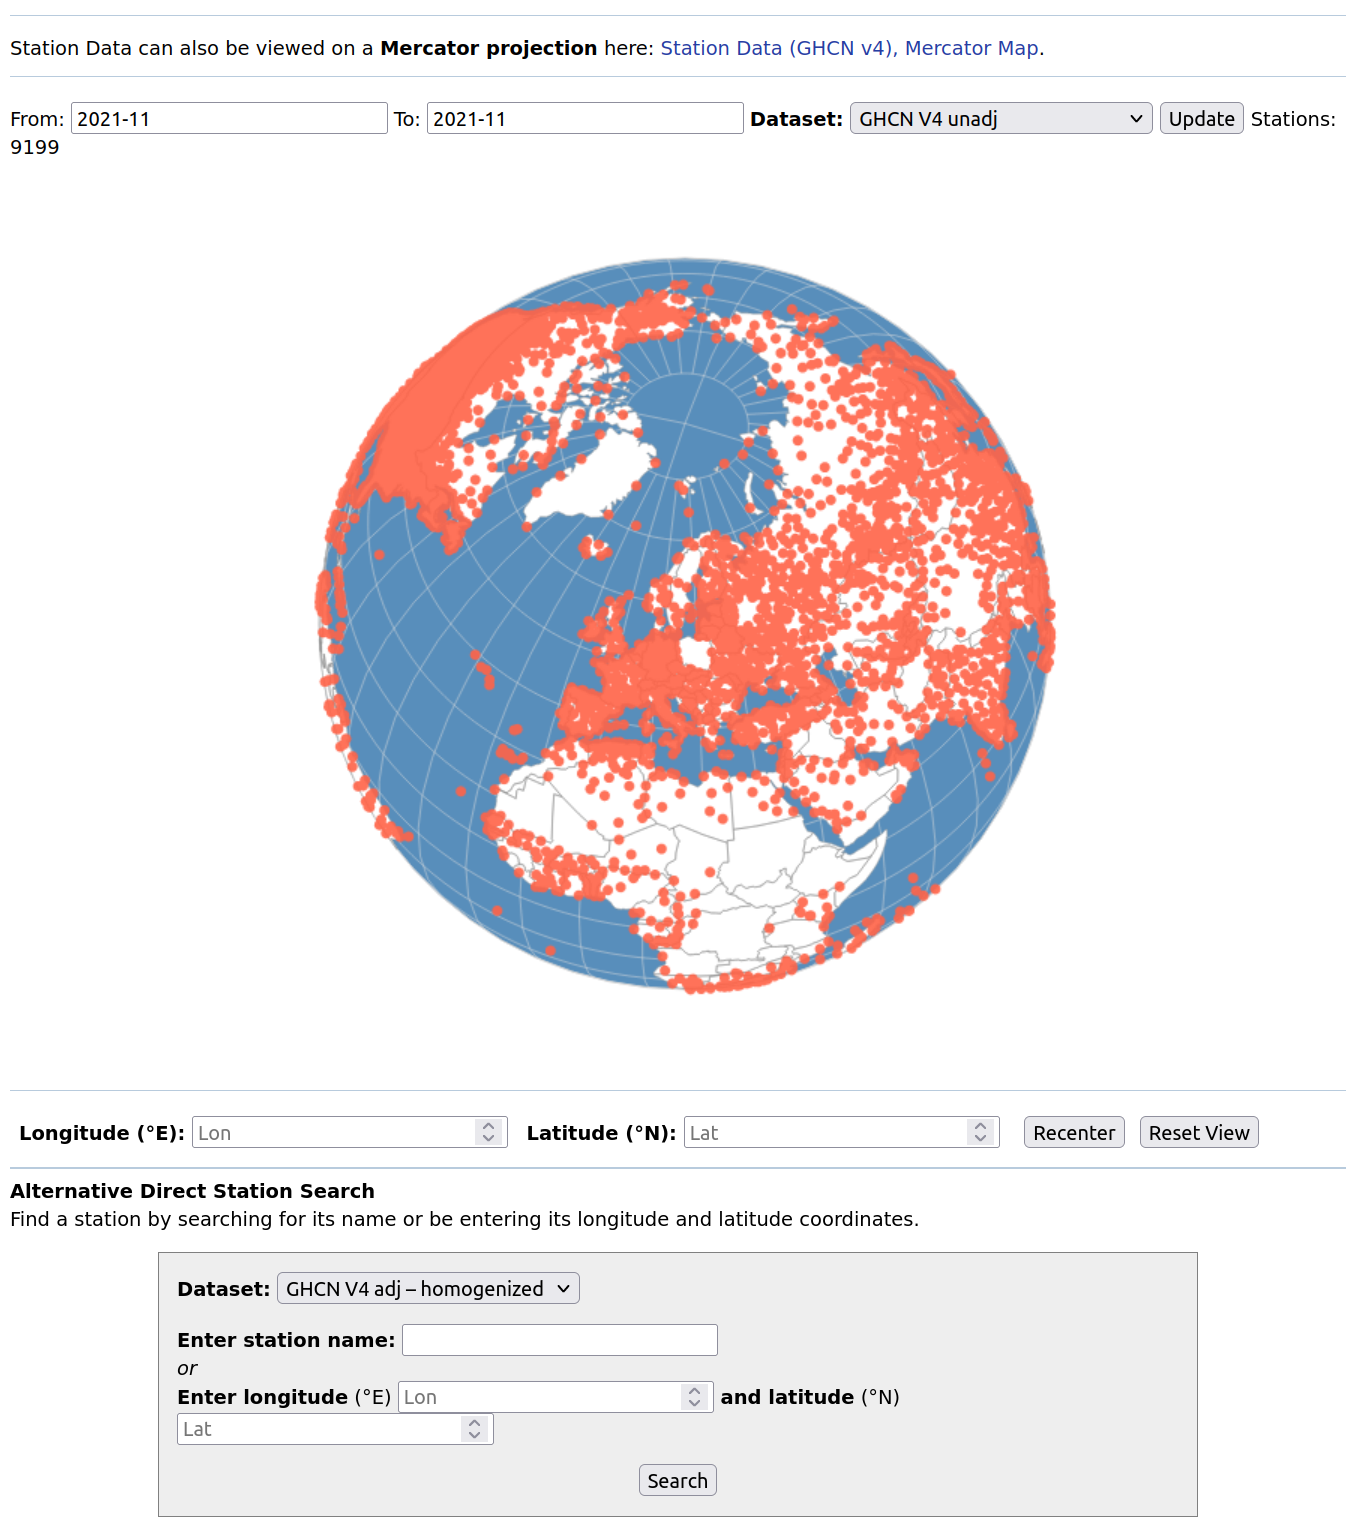
There is currently a new page with a “version 4 dataset” here. This is how it currently looks like:


Apriori this looks as if most of the stations are “back on track” but then I couldn’t find out within a decent time how much of this data is “reconstructed” in the sense of “educated guess” and how much is actual data from the respective stations. Another thing that caught my attention was that the content of the tooltipmenu of each station is partially non accessible, I don’t remember whether this is a new phenomenon.

Lobetal – In food chains

Thursday, July 3rd, 2014

(more…)

Periodicity

Sunday, June 22nd, 2014

This concerns a discussion on Azimuth. I found that the temperature anomaly curve, which describes the global combined land [CRUTEM4] and marine [sea surface temperature (SST)] temperature anomalies (an anomaly is a deviation from a mean temperature) over time (HADCRUT4-GL) has a two-year periodicity (for more details click here). The dots in the above image shall display, why I think so. The dark line drawn over the jagged anomaly curve is the mean curve. The grey strips are one year in width. A dot highlights a peak (or at least an upward bump) in the mean curve. More precisely there are:

18 red dots which describe peaks within grey 2-year interval
5 yellow dots which describe peaks out of grey 2-year interval
(two yellow peaks are rather close together)
1 uncolored dot which describes no real peak, but just a bump
4 blue dots which describe small peaks within ditches

One sees that the red and yellow dots describe more or less all peaks in the curve (the blue dots care about the minor peaks, and there is just one bump, which is not a full peak). The fact that the majority of the red and yellow dots is red, means that there is a peak every 2 years, with a certain unpreciseness which is indicated by the width of the interval.

Upon writing this post I saw that I forgot one red dot. Can you spot where?

Especially after doing this visualization this periodicity appears to me meanwhile so visible that I think this should be a widely known phenomenom, however at Azimuth nobody has heard yet about it. If its not a bug then I could imagine that it could at least partially be due to differences in the solar irradiance for northern and southern hemissphere, but this is sofar just a wild guess and would need further investigations, which would cost me a lot of (unpaid) time and brain. So if you know how this phenomen is called then please drop a line. If its not a bug then this phenomen appears to me as an important fact which may amongst others enter the explanation for El Niño.

Altruism vs. selfish

Tuesday, October 22nd, 2013

There seems to be an interesting article adressing climate change challenges called: “Intra- and intergenerational discounting in the climate game.” Despite the fact that the article claims to contribute to a better dissemination of knowledge about climate change the article is behind a pay wall. And despite the fact that at least some of the authors seem to be payed (?) by a german public institution (that is they are listed under staff) the article seems also not available via their institutions list of publications. Are the authors or the institutions paid by the publisher? Anyways one diagram of the article is visible and it seems to tell quite a bit about the content of the article.
(via phys.org)

What’s Fukushima accident’s death toll?

Saturday, June 1st, 2013


“Meeresfürchte”, an artwork by Johann Merkewicz questioning food safety

I am currently have an argument with John Baez on Azimuth. My comment is currently awaiting moderation.

John wrote:

..the death toll due to nuclear power was a negligible fraction of the overall death toll due to the tsunami. The Japanese should be improving nuclear safety and building in better organizational checks and balances, rather than shunning nuclear power.

What do you call negligible?

According to Wikipedia there were 15883 confirmed earthquake/Tsunami related deaths and 2,676 people missing.

In an Bloomberg article by R.P. Gale and E. Lax one finds:

And what of the lasting threat from radiation? Remarkably, outside the immediate area of Fukushima, this is hardly a problem at all. Although the crippled nuclear reactors themselves still pose a danger, no one, including personnel who worked in the buildings, died from radiation exposure. Most experts agree that future health risks from the released radiation, notably radioactive iodine-131 and cesiums-134 and – 137, are extremely small and likely to be undetectable.

Even considering the upper boundary of estimated effects, there is unlikely to be any detectable increase in cancers in Japan, Asia or the world except close to the facility, according to a World Health Organization report.

On the website of the World Health Organization report one finds amongst others:

In terms of specific cancers, for people in the most contaminated location, the estimated increased risks over what would normally be expected are:

all solid cancers – around 4% in females exposed as infants;
breast cancer – around 6% in females exposed as infants;
leukaemia – around 7% in males exposed as infants;
thyroid cancer – up to 70% in females exposed as infants (the normally expected risk of thyroid cancer in females over lifetime is 0.75% and the additional lifetime risk assessed for females exposed as infants in the most affected location is 0.50%).

By this it looks indeed as if one wouldn’t see an increase of the overall cancer rate in all over Japan. However it is not said here what this means in absolute numbers. How many more cancer cases/deaths are there to be in total?

(This report is also cited by the german GRS report as “the” main source (see p.59) for the estimation of future health risks due to the Fukushima accident.)

In the above citation of R.P. Gale and E. Lax it is in addition mentioned that there were no deaths due to radiation exposure. World-nuclear.org (which I often cite, because they are rather pro-nuclear and often rather well-informed) seems to assert the same, they write:

There have been no deaths or cases of radiation sickness from the nuclear accident, but over 100,000 people had to be evacuated from their homes to ensure this. Government nervousness delays their return.

(please note that from this sentence it can be (and usually probably will be) ambiguously infered that “There have been no deaths from the nuclear accident…”, which is not true, please read further)

The assertion that there had been no deaths due to radiation (which is also cited as such on Wikipedia) is eventually based on a sofar unpublished study by UNSCEAR , which was mentioned in an article by Brumfield, who writes:

So far, neither operator seems to have suffered ill effects as a result of their exposure.

Furthermore it seems that the UN thinks there were 6 dead workers, who did not die from radiation.

I think this should be scutinized. In an email from Karl Feintuch at the United States Nuclear Regulatory Commision (USNRC) (p. 76) (here another internet capture) it is reported that:

Japan reports 5 persons have received lethal radiation doses

but as he points out: there should be “caution regarding maturity and reliability of that information”. Furthermore Tepco reported at least one death, which sounds to me by the description very much radiation related (but this is only a Google translate):

For one person seriously injured who had been trapped in the tower crane cockpit of the exhaust tube,
Is transported to the ground from the tower crane in 13 minutes 5:00 pm today, died in 17 minutes 5:00 pm
Has been confirmed.

Moreover if you read reports as the article “Worker wants new government to secure safety at Fukushima plant” in Asahi Shimbun, than you may ask yourself how exhaustive and good is the monitoring of the health of workers at the Fukushima plant?

A TEPCO employee in his 20s who grew up in Fukushima Prefecture has become an opponent of nuclear power after the accident at the Fukushima No. 1 plant.

“I was told to work at the plant like a kamikaze pilot,” said the man, who is evacuating from Fukushima Prefecture due to high levels of radiation he received. “I have no idea about how much radiation I was exposed to.”

What kind of treatment receive these workers who risk their health and lives for mitigating the effects of such a catastrophe?

But let’s have again a look on the overall mostly future expected casualities:

According to the study “Worldwide health effects of the Fukushima Daiichi nuclear accident” by John E. Ten Hoeve and Mark Z. Jacobson (via Bloomberg.com)

We find that inhalation exposure, external exposure, and ingestion exposure of the public to radioactivity
may result in 15 to 1300 cancer mortalities and 24 to 2500 cancer morbidities worldwide, mostly in Japan. Exposure of workers to
radioactivity at the plant is projected to result in another 2 to 12 cancers cases.

So their “best estimate” as Evan Douple called it in the bloomberg article is about 130 deaths.

The Results were evaluated against daily worldwide Comprehensive Nuclear-Test-Ban Treaty Organization (CTBTO) airborne radionuclide concentrations and deposition rates from around Japan.
Atmospheric and ground concentrations of iodine-131 (I-131), cesium-137 (Cs-137) and cesium-134 (Cs-134) were then used to estimate the worldwide health effects from the radioactive fallout

On a first glance into the paper it looks to me as if for example sea and groundwater contamination via the ongoing release of contaminated water and eventual future contaminations had not been taken into account.

The study
Accounting for long-term doses in “worldwide health effects of the Fukushima Daiichi nuclear accident” Jan Beyea, Edwin Lyman and Frank N. von Hippel (via asianscientist.com) finds:

On balance, the net result of adjusting the TH&J numbers to account for long-term dose from radiocesium is uncertain, but the mid-range estimate for the number of future mortalities is probably closer to 1000 than to 125.

According to a report in Yomiuri Shimbun there are at least 537 deaths which had been certified by municipalities as a direct consequence of the Fukushima disaster.

So if one accepts a cancer related death toll of 1000 people (i.e. a higher but possible projection in the Ten Hoeve and Jacobson fallout study or the expected average toll in the Beyea, Lyman and von Hippel article) and if adds these the stress related 573 deaths one has currently a prognostized Fukushima accident death toll of about 1600 people.

This is roughly about one tenth of the casualties of the earth quake/Tsunami catastrophe. Is that negligible?!

Moreover the Fukushima air circulation blew about roughly 81% of the fallout onto the open sea. That means if the winds would have been blown onto land then this would have given at least a factor 5 more fallout on possibly populated land (if one assumes approximately equal population density). But if one takes into account that the wind almost never blew into south direction (eventual erranous personal observation) , i.e. almost never into the direction of the densely populated Tokyo area then it sounds cautious to assume a factor of ten for what the cancer rates could have been under different weather conditions. That is in that case the death toll could have been about as big as the death toll of the earth quake/Tsunami catastrophe.

And I don’t want to imagine the death toll which would have been a reality if additionally a criticality event would have turned into a chain reaction.
Maxwell’s equations of human behaviour

Monday, May 27th, 2013


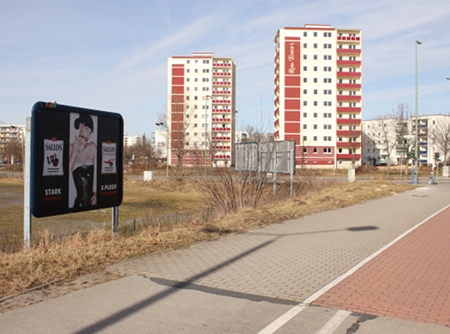
on the attractivity of locations: refurbished buildings in Marzahn-Hellersdorf, among them the now newly renovated Rhin Towers

I have found Maxwell’s equations of human behaviour!

(more…)

FuturICT

Monday, February 4th, 2013


Musician Imogen Heap in her tech wear

In a recent comment on randform randform reader Bibi asked:

You had written at Azimuth that your idea to use MMOGs for simulating economic and political real world scenarios

seems to have recently been picked up for the Global Participatory Platform of the 2013 Flagship proposal FucturICT

It seems also that your scientific platform idea had been picked up for that ICTfutur grant proposal.

What about your intellectual property?

The FuturICT application for 1 billion Euros had though been turned down, will you now write an EU grant proposal?

Answers to this comment after the click.

(more…)

cлonklusions

Wednesday, October 17th, 2012

Following an article in the Daily Mail, there is currently an interesting discussion at Azimuth about the interpretation of climate data. While the Daily Mail is convinced that global warming stopped 16 years ago as written in the article:
Global warming stopped 16 years ago, reveals Met Office report quietly released… and here is the chart to prove it, the news agency France24 looks at what for example shipping developpers think about the karma of global temperature variations:
Shipping developers eye up route through melting Arctic
However I don’t know how much the depiction* of Walrusses in a russian canteen should indicate how this may change the menu.

*please scroll down to about to the half of the image, next to the word Stoloweia.

mort about education

Tuesday, March 13th, 2012


monsters from a 9 yr. old, more images after the text

randform reader spitzketreiber wrote in a comment to the last blog post:

so you don’t want to mingle your kid with the normal kids in that school, isn’t that elitistic and in contradiction to the egalitarian views you expressed here on this blog?

What do you mean with egalitarian? I think every human has the right for half-way decent living conditions that is in particular everybody should have access to food, housing, education and health care, but thats not egalitarian as in the usual sense.

Moreover I didn’t say that I don’t wan’t to mingle my kid with the “normal” kids.

On the contrary. I do think that it can be good to bring rather different types of kids together. However the size of the classes and the ratio of teachers and or supervisors/social workers to pupils/group members matter a lot if you have different types of pupils/group members. I worked in the early eighties in a preschool where disabled, mentally retarded and “normal” children were brought together in one group. I found it was for all children a win. However for this project the ratio of teacher/supervisor/kid was about one teacher for 1-2 kids and this ratio was definitely necessary.

In general it is important that each kid has something to work on, something were it can grow its abilities. If you have a group of very different kids it is often not so easy to find the right means to realize this.

Like in the case of specific mind tasks you have to keep the intelligent kids busy enough with suited and meaningful tasks so that they don’t start to get too bored. Likewise slower kids need to get a task, which is adapted for them, a task were they feel not swamped and were they have enough freedom to work at their pace. Alpha animals have to be often kept at distance, cultural obstacles have to be resolved, some people need a special amount of physical workout, some people talk a lot, some people are better able to adapt etc. In general one can say the more different a group, the harder it can be to “keep the group together” for a longer time while simultanously get some work done with some portion of efficiency. Moreover with a smaller teacher/kid ratio the evaluation of abilities is more difficult. So it may happen that very different people supplement each other and may easily form a group however in the generic case one can rather observe that often either people sort themselves (“social segregation”) or that they are sorted prior to forming groups and/or that they are “streamlined” via pressure and rules (please see also the comment on the moderation of groups). Thus school classes are e.g. formed by sorting via grades and/or other aspects, like tuition etc. The bigger the classes, the less teachers there are, the more streamlining and sorting may be necessary in order to keep a certain standard. Ever done chemistry experiments with a bunch of over 30 ten year olds in a small room? I did this and I can say it can be challenging.

In a lot of the Berlin gymnasia which are mentioned in the previous blog post there seem, at least by what we have heard, to be less social and cultural differences than in that gymnasium in Marzahn-Hellersdorf at which our kids are currently. In that sense it seems the social and cultural components of difference may be lower in these schools then in this school in Marzahn-Hellersdorf and thus if you have the same amount of too many pupils this may be a learning advantage.

In the case of our son we thus have – apart from the Berlin-Bavarian problem with spanish as a second language (which wouldn’t be resolved by sending him into a “normal” class at this school and I am still quite angry that they didn’t tell us when we applied for that school that french is going to be eliminated) – to figure out wether it is better for our son to stay in his “presorted” class with a higher teacher ratio per kid, however with a higher teaching speed (“fastgoerclass”) or to change to a rather crowded class with probably more tensions due to more and more different pupils. I should also say that depite the fact that his class was already more “sorted” than a “normal” class (kids in these kind of classes have often parents which have a high interest in good education) there were already big overall tensions (especially among the boys) and that the math teacher spend his free time to speak with the boys and to establish a kind of anti-bullying system. One should also mention that the school had to undergo a major restructuring and that there is a rather high fluctuation of teachers, because of e.g. changing pupil numbers, the restructuring and school reforms. So for example my daughters class has now the fifth math teacher (temporary staff not included) in four years. Moreover an overall higher teaching speed (as said the gymnasia in Germany were roughly shortened by a year in recent times) together with higher challenges of a technological society put additional pressure on schools and kids. This school in Marzahn-Hellersdorf has some excellent teachers and it is frustrating to see how they are struggling. There was recently also a study, which displayed that the current german school system produces a lot of “loosers”, from the article Deutschland, Land der Schulabsteiger

“Selbst in Sachsen, dem informellen Sieger der neuen Studie, kommen auf einen Schulaufsteiger elf Schüler, die aus dem Gymnasium in eine niedrigere Schulform herabgestuft werden. In Niedersachsen sind es 12, in Berlin gar 14.”

translation without guarantee:

Even in Saxonia, the informal winner in the study, it was that for one fast climber there are eleven pupils which are decending from Gymnasium into a lower school form. In Lower Saxonia there are 12 and in Berlin even 14.

Big classes are of course motivated by economic considerations and similar dynamics with high teach speed and bigger “classes” take place in higher education. For example a year and a half ago Tim had to give lectures in front of about 1000 ! students – he had already to think about wether it may be necessary to split his lecture via a video screen into two lecture halls. I call this an academic Musikantenstadl.

The New York times had recently an article which conscisely summarized two major components of these dynamics. One effect is the socalled “Baumol’s disease”:

Some of that growth has resulted from a phenomenon called Baumol’s disease, after the economist William J. Baumol, who described it in a 1965 article he wrote with William G. Bowen. The basic idea is that while productivity gains have made it possible to assemble cars with only a tiny fraction of the labor that was once required, it still takes four musicians nine minutes to perform Beethoven’s String Quartet No. 4 in C minor, just as it did in the 19th century.

College instruction more closely resembles a musical performance than an auto assembly line. Although information technologies have yielded some productivity growth in academia, instruction still takes place largely as it always has.

In some sense one can see this dynamics as a indication that humans (the training of, the maintanance of etc.) are loosing against the market competivity of machines and this is not only the case for the industry sector but increasingly also the case for the socalled knowledge economy. Note in particular that teaching becomes especially part of the monetarily sucessful section of knowledge economy if it is not mainly concerned with teaching “mentally weak” humans (or whoever appear as such) but humans which are able to construct, run and maintain high tech, i.e. “machines.”

This becomes also apparent in the second phenomenom which lies according to the New York times in “prestige hunting” (and the corresponding tuition costs):

“After adjusting for inflation, starting salaries for most graduates have remained essentially stagnant for several decades, while those at the bottom of the group have actually declined. Only the highest-paid graduates have enjoyed significant salary growth, and among those a very thin slice at the top has seen truly spectacular increases.

Because of the bitter competition for those premium salaries, elite educational credentials are often a precondition for even landing a job interview. With so many applications for every vacancy, many consulting firms and investment banks, For example, now consider only candidates from a short list of top-ranked schools.”

That is consulting firms and investment banks are of course to a great extend part of what can be seen as “knowledge economy”, in particular sophisticated financial instruments make extensive use of computers, i.e. “machines” and the humans, which are assumed to be able to create e.g. the best computer programs and financial models are thus more sought after.

More components like growing social inequalities and declining ressources play of course also a role.


car and gadget design from a 10 yr. old

dragon from a 9 yr. old


dragons from a 9 yr. old


fight from a 9 yr. old


monsters from a 9 yr. old


mom and batman from a 8 yr. old


seizure from a 11 yr. old

Berlin schools

Saturday, March 3rd, 2012

flockennah450.jpg

When our son, who is now in 6th grade was about to enter the 5th grade we decided that a higher school (gymnasium) would be better suited for him then the class in the grammar school on which he was at that time. Unfortunately this was only possible by entering a socalled “Schnellläuferklasse” (Fastgoerclass means one year school is skipped), which we didn’t find optimal, but since the school which he could go to (in Marzahn-Hellersdorf) was actually good (our daughter was already there) we decided we could go with this. Unfortunately it turned out last year that the school doesn’t have any more capacities to offer french as a second language (as what we would have chosen) but only spanish. Since Tim works in Munich and there are no higher schools in Munich which offer spanish as a second language moving back to Munich would be a problem with a choice of spanish as a second language (second languages start usually in the 7th grade). Moreover we are not really happy with the concept of Schnellläuferklasse* (especially since school time had already been drastically shortened in Germany) , so we were considering a school change. Unfortunately our son has (including preschools) already visited 7 different schools on 3 different continents so we are very reluctant about another change. Moreover we got sofar rejections from most of the gymnasiums which are halfway reachable (Berlin East) and which somewhat support his affinity for art and natural sciences that is we received rejections from: Coppi-Gymnasium, Otto-Nagel-Gymnasium and Dathe Gymnasium. The Heinrich-Hertz-Gymnasium fell out of choice for several reasons. He is on the waiting list of one Gymnasium in Marzahn-Hellersdorf, which would be a last possibility for a change, but we don’t know much about that school. If someone has any tips on that issue please let us know.

*there were actually more parents in his class unhappy with this concept and there were discussion wether one should give up the Schellläuferklasse Concept (there was a little time window last year for doing this). In a Schnellläuferklasse kids which are good in school are gathered and there are less kids in such a class then usual, so the majority of parents from that class at that school in Marzahn-Hellersdorf found the perspective to mix their kids into an overcrowded class less apealing.