What is going on at the Sun?
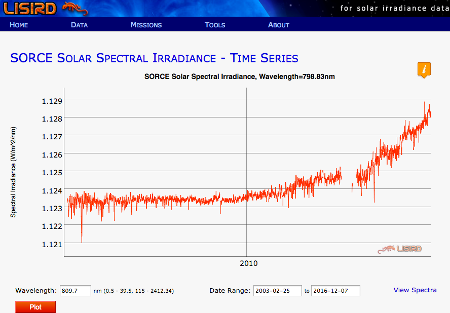
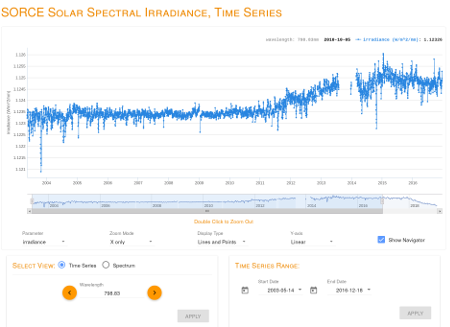
In the randform blog post Information about solar irradiance measurements sought, I had posted a visualisation of irradiance data from the Laboratory for Atmospheric and Space Physics (LASP). In the post it was discussed that there could be a rise in irradiance based on the data from their SORCE mission. I think the rise is also somewhat visible in this interactive plot at the Interactive Solar Irradiance Data Center (LISIRD)…that is it is visible until about July 2015. In this post I also posted a picture of the line 774nm, i.e. “red light” which is slightly out of the visible spectrum. The reason was that it seemed that specific line ranges displayed a stronger rise than others (see circles in the other image in this post). Back then I even made some screenshots from the LISIRD visualization, here you can see the close-by line 798.83nm:
Here it is again in my visualization:
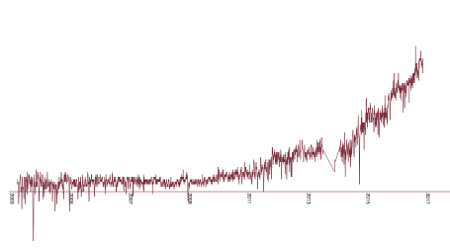
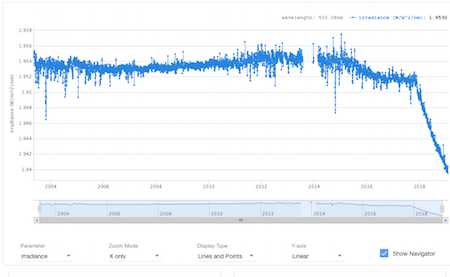
Both visualizations look pretty much the same apart from some visualization effects. But this is how the line in the above time range (here until Dec 18 in 2016) looks as of today in the new LISIRD app:
So things look very differently since about early summer 2015. Is this a correction?
Why might this be interesting ?
It is certainly important to understand whether the irradiance of the sun is getting stronger or not, decide yourself whether this makes the discussion of those issues interesting.
The historical total irradiance is usually reconstructed via sun spot activity and measurements are sought to be brought into accordance with those reconstructions. This should work fairly well if there are no major changes in how the sun is operating. It may though be less suitable if major changes would take place. The sunspot activity is currently actually rather in decline, have a look at the American Relative Sunspot Number – Daily, Time Series . So accordingly a reconstructed time series like from Empire (please type in 797nm, I found no direct linking possibility) displays a reconstructed irradiance which is currently also rather in decline. You can obseverve this for example by noting that the total irradiance in Feb. 2003 (i.e. a little after the last peak) is in the Empire series about the same as for the following peak in July 2014.
This isn’t though in the SORCE measurement. There the peak in July 2014 seems on average higher than at the beginning of the measurement in Feb 2014 (as of today).
What about that 798.83nm line?
Specific line ranges might eventually be linked to certain nuclear processes in the sun. A discussion about this at Azimuth Forum.
So here now again a screenshot of the 798.83nm line as it has been continuing in the correction through 2017 and 2018:
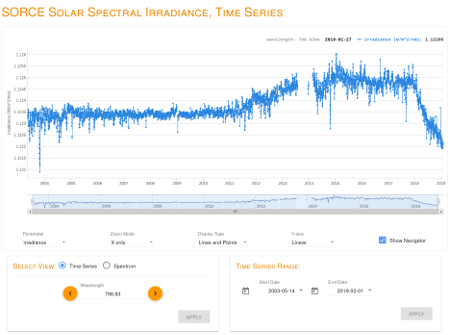
….no further comment necessary, I think.
So again my question to the randform audience: Do you know of any other direct irradiance measurements?
addition 05022019:
Due to requests from commenters, here some additional info.
As far as I know the SORCE data is currently the only openly available off-earth spectral irradiance data, which covers the spectral ranges and time ranges (covering at least some years ) in question. I had written an email to the head of the world radiation center in Dec 2016 where I asked whether there are other data sets but got no answer.
By the way on their web page the world radiation center states:
Swiss researchers are hoping for a mitigation of climate change: Sounds crazy, but solar radiation could mitigate global warming by up to 0.5°C. Researchers are now checking whether this is justified.
There is one mission (also mentioned on the main LISIRD page) which provides spectral data from 265-500nm, the dutch OMI Spectral Irradiance.
But first the SORCE lines:
The line 500.8nm from end 2016:
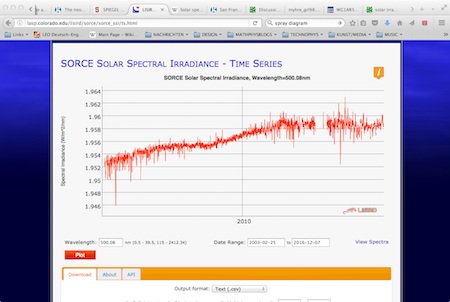
Here the “corrected” 500.8nm line from SORCE:
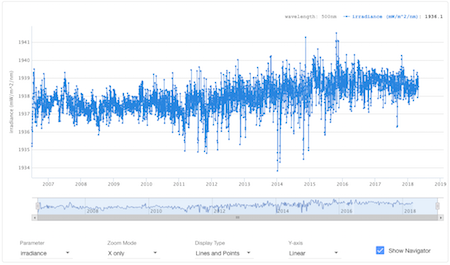
And here the 500nm line from OMI:
It looks more like the above mentioned uncorrected versions.
February 5th, 2019 at 8:26 am
Frankly – Instead of asking your audience about other measurements it’s rather you who should do a thorough research and present it here!
Did you look at the document you linked to? SORCE was already on an extended mission so no wonder that it’s instruments were outdated. The above shows clearly that the SIM ( the spectral irradiance monitor) didn’t work properly anymore. I bet there are multiple other missions like the SORCE mission who deliver better and fresher measurements. The document even names a few ! Read page 4! There is: TSIS-1, TIMED, SDO (EVE), GOES EXIS. Please look yourself and don’t steel your readers time!
February 5th, 2019 at 10:16 am
I supplemented the post with some more info. Please have a look at this.
February 17th, 2019 at 2:07 am
Randform claims sun is sending more radiation but scientists say earth cools. What are you thinking – after billions of years sun suddenly changes in 2017?
February 19th, 2019 at 11:21 am
@Victor
It seems author hasn’t heard of vortex systems go high up into ionosphere:
(citations from article Main results of recent investigations into the physical mechanisms of the interaction of tropical cyclones and the ionosphere)
March 24th, 2019 at 7:25 pm
@ Zebra, Victor and Dura S. Uma-Schla
The SORCE mission is on the SORCE spacecraft:
The OMI mission is on the Aura spacecraft:
The OMI was built by :
whereas the spectral irradiance measurement instrument (SIM) was probably built by some of these people i.e. it seems to be an US project.
So two different spacecrafts in different heights and orbits with two different instruments measuring somewhat the same rise at 500nm over a couple of years. This doesn’t suggest to me that the rise is due to the influence of some cyclones or similar phenomena.
Based on the total irradiation data I had said there could be a rise in total irradiation, but I had also pointed out that that this is just a very preliminary estimation, because amongst others it is not even clear whether my estimation “correctly” covered the whole sun cycle.
Anyways the above are irradiation rises for certain spectral ranges only and not the total irradiance for all ranges. In principle these rises could eventually be even part of the sun cycles as some kind of fluctuation. I don’t know. It should however be said that the SORCE SIM measurements extend over the 11 year cycle. It may be hard to read in the above image but the SORCE measurement started 2003-05-14 so it covered roughly about 14 years until end of 2016.
As far as I know the predictions of less total irradiation (and thus cooling) might eventually at least in part be due to an interpretation of sun spot activities. The sun spot activity is currently going down.
So apriori the rise in the above spectral ranges could be part of a process which leads to a decline in sunspot activity. As a side remark in this context:: there were severe climatic changes in the northern hemisphere before and around the Maunder minimum which is suspected to be eventually connected to the Little Ice age.
March 26th, 2019 at 7:59 pm
Are you sure you are allowed to post those screenshots? This might be a copyright infringement.
June 9th, 2019 at 11:51 am
Sorry but I don’t by into that.
Could you please provide us with the concrete magneto-hydrodynamic model which explains your alledged subtle irradiation rise for certain spectral ranges? Usually magneto-hydodynamic effects are way more pronounced.
June 10th, 2020 at 8:38 pm
@Cash why zahl Nali
I recommend the article “Reconstruction of total and spectral solar irradiance from 1974 to 2013 based on KPVT, SoHO/MDI and SDO/HMI observations” at https://arxiv.org/pdf/1408.1229.pdf
The authors present a “SATIRE-S model reconstruction of daily total and spectral solar irradiance spanning the period of 1974 to 2013.” As far as I can tell Satire-S is some kind of magneto-hydrodynamic model.
From the conclusion;
So I understand this as that basically modelling fails (?)/failed beyond 250nm, And the problem seems to be also the instruments from the SORCE mission:
I understand this as that they think that those SORCE/SIM SSI instruments show some unaccounted weird trends. They conclude that:
But of course they also highlight that measurements are iimportant as well:
But as far as I can tell they sofar didn’t look at OMI.