What’s going on at the Ural?
![]()
In an earlier randform post I mentioned the connection of methane emissions and geological features. In particular in an area called Vestnesa which is about northwest of Svalbard (look at image 3) high methane emissions were due to plate tectonics. In that post I asked wether this fault couldn’t be eventually part of a plate which arises from a break of the Eurasian plate, i.e. in particular whether there are similar plate tectonical ongoings along the (northern part of) Ural. I was in part drawn to that question because of the above image. In the above image you see a plume (CH4 air masses) starting at the Kara sea and then going down south in the west of a line, which seems to indicate the Ob river. I.e. this plume seems to be going down at least along the northern part of the Ural mountains. The image is on a world scale so this is a bit speculative, but still, it looks as if. But since the resolution is so crude it should also be mentioned that east of the Ob there are major gas fields, like at Novy Urengoy.
So via ars technica I now found the amazing “Atlas of the Underworld,” where seismic tomography is used to reconstruct vertical cuts through the earth “from the surface to the boundary between the mantle and the Earth’s liquid outer core at a depth of 2900 km.” The cuts are in particular used to look at slabs from the earth crust, which sunk into the mantle.
Apparently there is a slab quite at the bottom of the mantle, which is somewhat below the area of interest which is called Mongol-Kazakh. And so there are vertical cuts from this area.
Unfortunately I didn’t find any explanation with respect to the colouring of the “Atlas-of-the-Underworld”-images, so I hope my interpretations are right, namely that the blue parts are colder, denser crust-like parts and the red parts are less dense, hotter and probably liquid. I downloaded the other images from Mongol-Kasakh from the website, which include cuts through the Ural.
I put some of them here for display (see below).
Here my interpretations of what the images probably show:
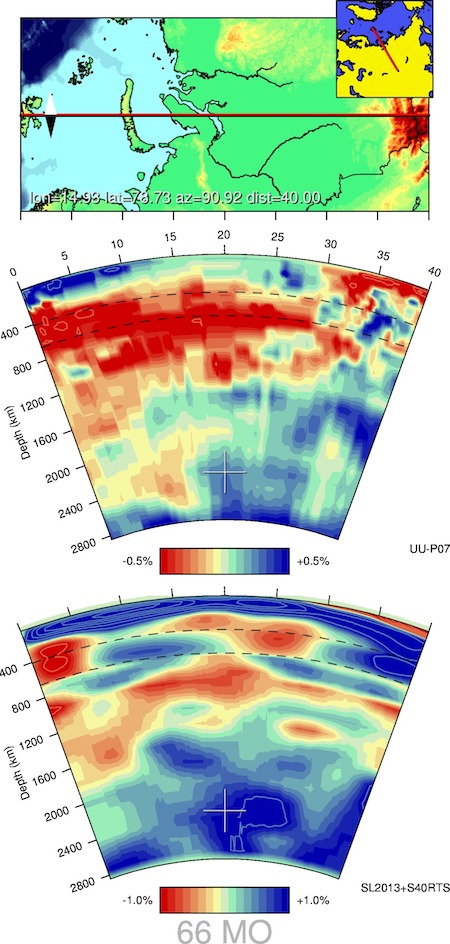
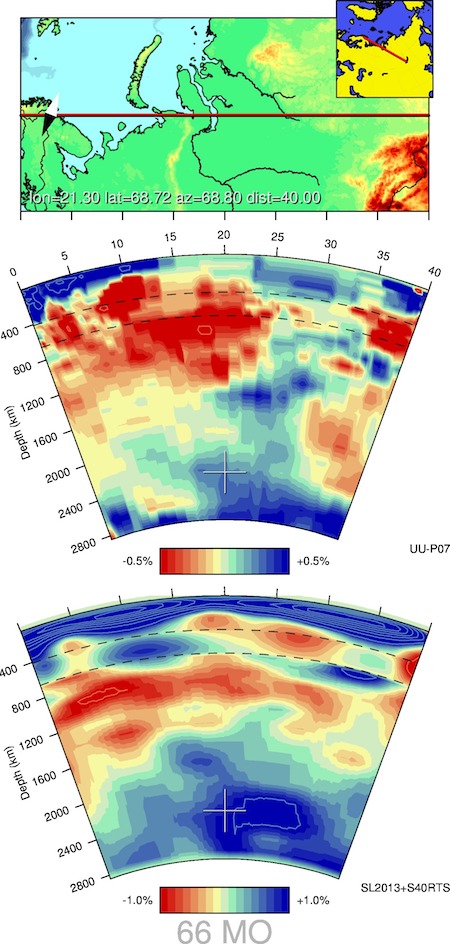
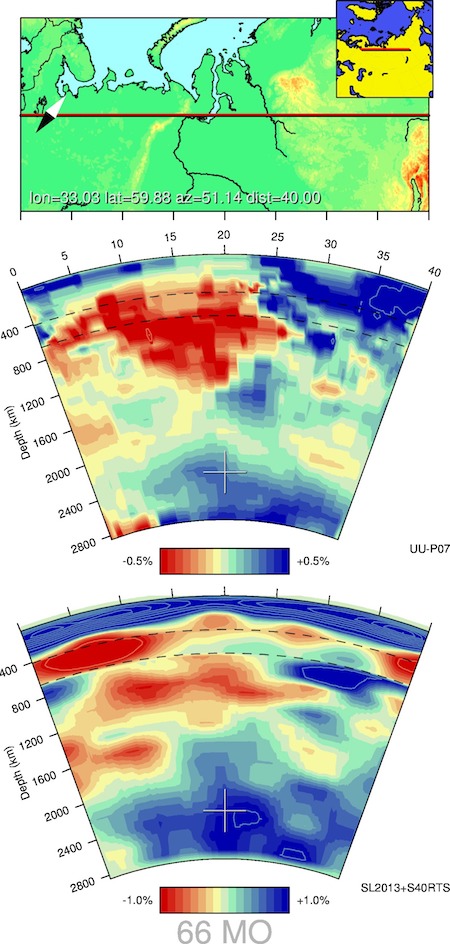
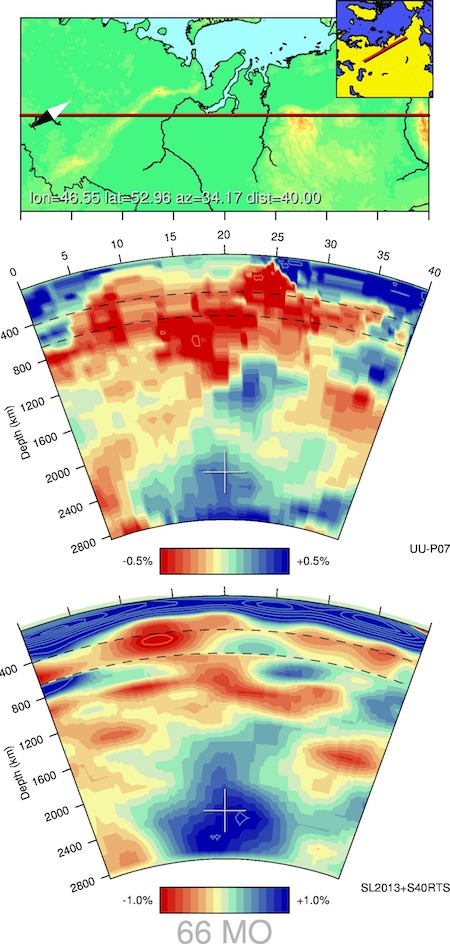
There are 6 jpg’s, each showing 3 images.
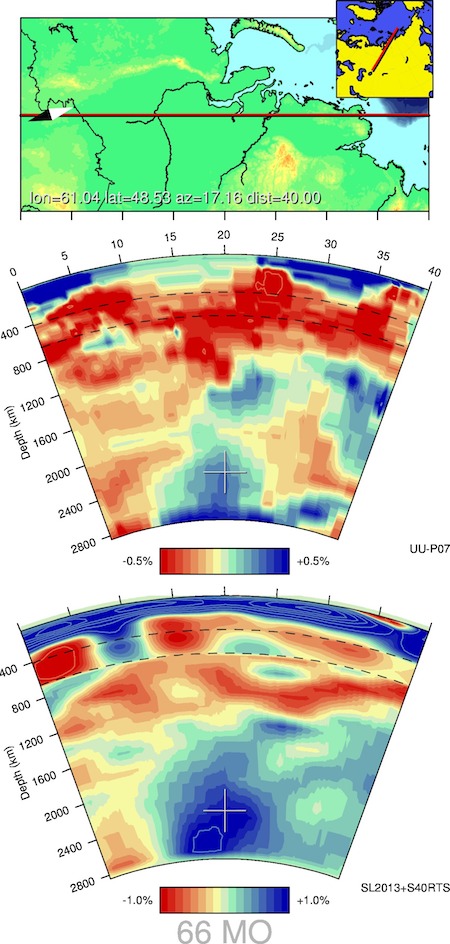
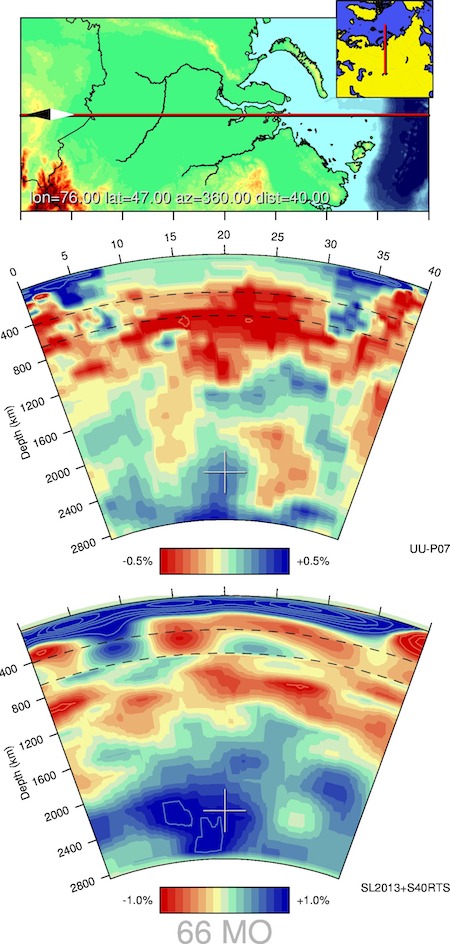
The first image of a jpg shows where the cut was made. It also seems to display the latitude, longitude, the angle with a direction (to the northpole?) and the distance (in thousands kilometers?). So a bit guesswork about the placement of the cut is involved here. The two following images of a jpg are probably reconstructions of seismic data. The first of the reconstructions carries the letters UU-P07, which seems to refer to a certain tomographic reconstruction model called UU-P07, which is linked to from the website. So I guess the letters SL2013+S40RTS are referring to another tomographic model. All the UU-P07 images show a less dense hotter region around river Ob, where in jpg 4 the crust seems especially thin along the Ural (on the west) and in one image also a thin crust east of the river Yenisei, which is by the way via the Angara connected to Lake Baikal, which lies in the Baikal Rift Zone, another “tectonically active region”. But lets go through the jpgs in more detail.
———————————————-
In the first jpg the cut seems to go from Mid-Svalbard to the Altay (or somewhere there). Unfortunately the Vestnesa seems not on the image. Lat 15 lon 79 seems to be around the station Jan Mayen (at least if googlemaps is right). One can see that the crust beneath Altay (distance 35-40) looks very thin.
———————————————-
In the second jpg the cut seems to go from Skandinavia to Lake Baikal. Here one sees only at the very end (close to lake Baikal?) a very thin crust. However around the river Ob one observes in the first cut an area where the crust seems to be less dense, because it is lightblue-greenish. This area will appear also in the following. It is not as clearly visible in SL2013+S40RTS but there one sees a thinning of the crust around that location.
———————————————-
In the third jpg the cut seems to go from the region around Novgorod to somewhere northeast of Lake Baikal. In the first cut no really thin crust is to see just the -as already mentioned “less dense crust piece” along river Ob and a slight thinning at this less dense crust around distance 18. The Ural (around distance 15) seems to be the western border of this “less dense crust piece”. Again SL2013+S40RTS is less pronounced but displays a thinning of the crust around that piece.
———————————————-
In the fourth jpg the cut seems to go from around Saratov to somewhere what looks like the Verkhoyansk Range. In the first cut the crust seems to be rather thin at the borders of our “less dense piece” namely around distance 10 and 25, which seems approximately in the west at the Ural close to region Sverdlovsk and in the east to the western parts of Krasnoyarsk region. Sverdlovsk is already pretty south, so again this cut estimation is not at all precise, but thats what I currently see there – a thin crust around Sverdlovsk and Krasnoyarsk and a less dense region in between. Here though the SL2013+S40RTS reconstruction does display only the Sverdlovsk thinning, not the Krasnoyarsk.
———————————————-
The fifth jpg shows a cut which is more or less parallel to the Ural on the east, again one sees a less dense piece around river Ob and a very thin crust in the Laptev sea (distance 37).
———————————————-
The sixth image is more or less parallel to river Ob and it shows again a less dense piece around river Ob and a very thin crust in the Laptevsea (distance 37-40).
Concluding: There seems to be a less dense area of the earth crust around river Ob, whose west border seems to be lined by the Ural. This earth crust is partially rather thin, sometimes in the middle, sometimes at the borders. This piece may be connected to the Baikal rift.
Moreover -as some additional information – this piece seems to be located on the (western part) of an area with less gravitation (see image below).
So the “fault idea” along Ural in this randform post seems to me now definitely less speculative than before. It seems however that the unclear dashed Africa line in this randform post needs to go through the middle of Africa. That is as pointed out in the “>Spiegel article which links also to another article in Spiegel Online, which is based on that Journal article, Africa seems to break apart -especially in the north east- and there is “hot buoyant material rising from deep mantle beneath Africa and moving toward the northeast, facilitated by the movement of the Indian plate”.
So here two more cuts along this “fault line” now more towards the “fault” along Africa.
http://www.atlas-of-the-underworld.org/Sistan/
http://www.atlas-of-the-underworld.org/Arabia/
Unfortunately there seem to be currently no cuts for Africa at the
Atlas.

(image from article (in german) on Spiegel Online)
supplement 19.11.2017:
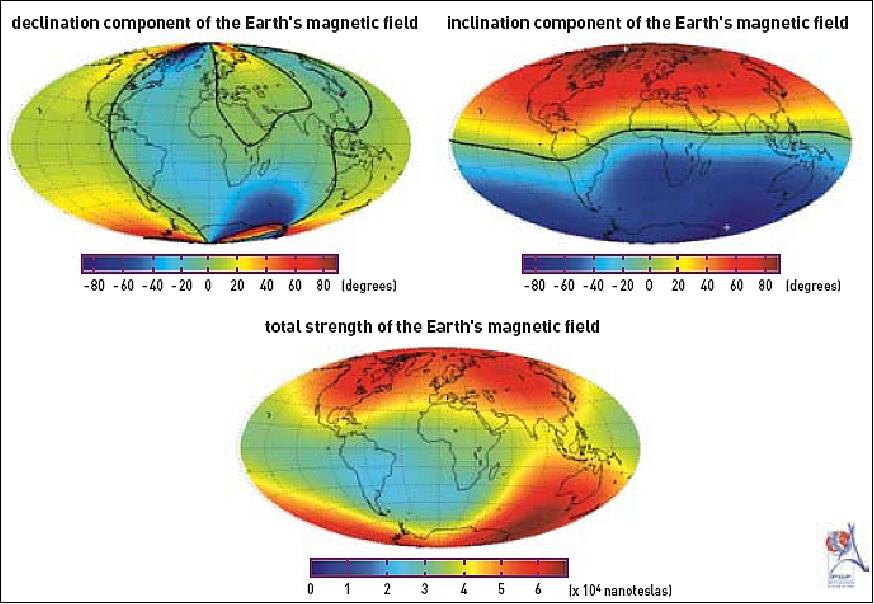
As a matter of fact there seems to be a rather strong correlation between the above mass map and the declination of the earth’s magnetic field:
image credit: The image is from geoportal and the image creit there is given to “LETI”, the reference being broken.
The text underneath the image reads:
“Figure 4: Map of the geomagnetic field strength at the surface of the Earth derived from the model produced using data from the Oersted satellite (image credit: LETI) 21)”
In this context you may also want to read the randfrom post “übergeben”.
