Exploring Climate Data (Part 3)
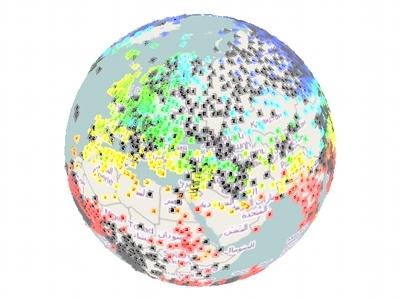
The attentive randform reader knows (see posts here and here) that Tim and me did an interactive visualization in which temperature stations and their data from a socalled “CRUTEM 4 surface temperature data collection” where displayed on a globe. In the posts it was already found that the data collection “deteriorated” in the last years, i.e. that there were fewer and fewer temperature data, especially in certain regions, available. There is now a post on the blog Azimuth by me in which I give also an overview about other data sets and visualizations, in particular I refer also to all data sets which were used by the Intergovernmental panel on Climate Change (IPCC) for their 4th assessment report, i.e. the report which was a major policy informer in the past recent years. In the blog post I just state what I have found and you can make up your mind about the state of data yourself. I state my opinion though in the comments to that blog post.