detoration explordaration
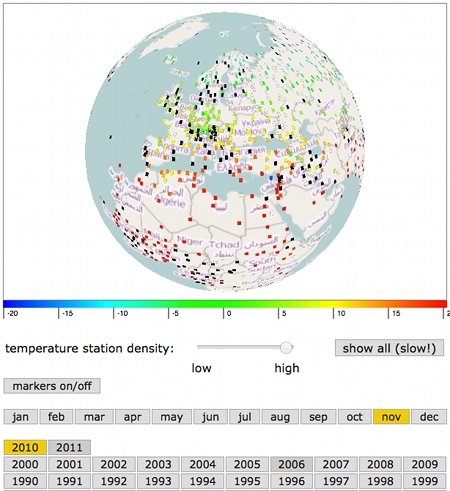
As was announced in the last post Tim and me were working at a visualization of the data collection CRUTEM 4 by the climate research unit (CRU) at the University of East Anglia. In the post it was mentioned that the data in that collection was sort of “deteriorating”. That is on one hand the number of active temperature measurement stations which were listed in this file (some stations started measuring already in the 18th century) decreased rather rapidly in the last ten years and/or the file contained increasingly invalid/no temperature data in the last ten years.
In that context it is worthwhile to note that CRUTEM 4 supercedes CRUTEM 3 and the CRUTEM 3 (grid data) was according to the Intergovernmental panel on Climate Change (IPCC) used for the IPCC fourth assessment report (AR 4).
Wether the “deterioration of that CRUTEM 4 data” has any effect on the assessment of the current global warming trends is another question. The application is now online. Explore yourself! Caution the data takes very long to load. The CRUTEM 4 data file is about 45 MB.
The following two interactive applications also display global temperature data:
– HADCRUT 3 (which uses CRUTEM 3) data is visualized here by Cliff Best.
– NOAAs Global Historical Climatology Network-Monthly (GHCN-M) is visualized here by Nick Stoves.
– our comparision of temperature anomalies, CO2 and methane values uses HADCRUT 4 which uses CRUTEM 4 and HadSST3 (sea surface temperatures).
warning: 18.10.2014
Unfortunately the application is currently not running anymore. Probable reason: It currently seems that WebGl Earth has moved two library files. In particular the WebGl earth API base script which we were thinking was self-contained unfortunately doesn’t seem to be self-contained. We are going to look at this trouble in the near future.
supplement 05.10.2014: The interactive visualization is currently working again. Klokan technologies had responded and promised to look into this problem.

September 16th, 2014 at 4:44 pm
Nobody asked you to do this visualization and it looks as if you
spend a lot of time with those scatterplots instead of getting a
paid job. We have currently a discussion about your situation at your censorship post, which you haven’t commented on. What do you intend to do with those scatterplots, apart
from – what this now looks to me – discrediting the IPCC? They are not even art.