Archive for the 'software' Category

On the deterioration of data

Thursday, August 21st, 2014

Tim and me are currently working on a interactive browser visualization using temperature data from HADCRUT, namely the CRUTEM 4 temperature station data which we map with the help of the open source web GL earth API (which seems to be to quite some extend the work of the Czech-Swiss company Klokan technologies) onto a model of the earth (covered with open street maps).
The visualization is still work in progress, but what is already visible is that the temperature data is quite deteriorating (please see also the previous randform post on the topic of deteriorization of data). Where it looks as if the deterioration had been bigger in the years from 2000-2009 than in the years 1980-2000. Below you can see screenshots of various regions of the world for the month of January for the years 1980, 2000 and 2009. The color of a rectangle indicates the (monthly) temperature value for the respective station (the station is represented by a rectangle around its coordinates) which is encoded with the usual hue encoding (blue is cold, red is hot). Black rectangles are invalid data. The CRUTEM 4 data file contains the data of 4634 stations. Mapping all the station data makes the visualization very slow, especially for scaling, therefore the slightly different scalings/views for each region and the fact that screenshots are on display. The interactive application will probably be not for all stations at once.

North America:


Jan 1980


Jan 2000


Jan 2009

Africa:


Jan 1980


Jan 2000


Jan 2009

Asia:


Jan 1980


Jan 2000


Jan 2009

Eurasia/Northern Africa:


Jan 1980


Jan 2000


Jan 2009

Northpole:


Jan 1980


Jan 2000


Jan 2009

update June 15, 2019:
There is now a similar interactive visualization at NASA for the GHCN data set at https://data.giss.nasa.gov/gistemp/stdata/

update December 29, 2021:
The link to our interactive temperature visualization, which was announced above in the post is here, the corresponding post about it is here.

The GHCN page linked on June 15, 2019 doesn’t show any station data anymore:

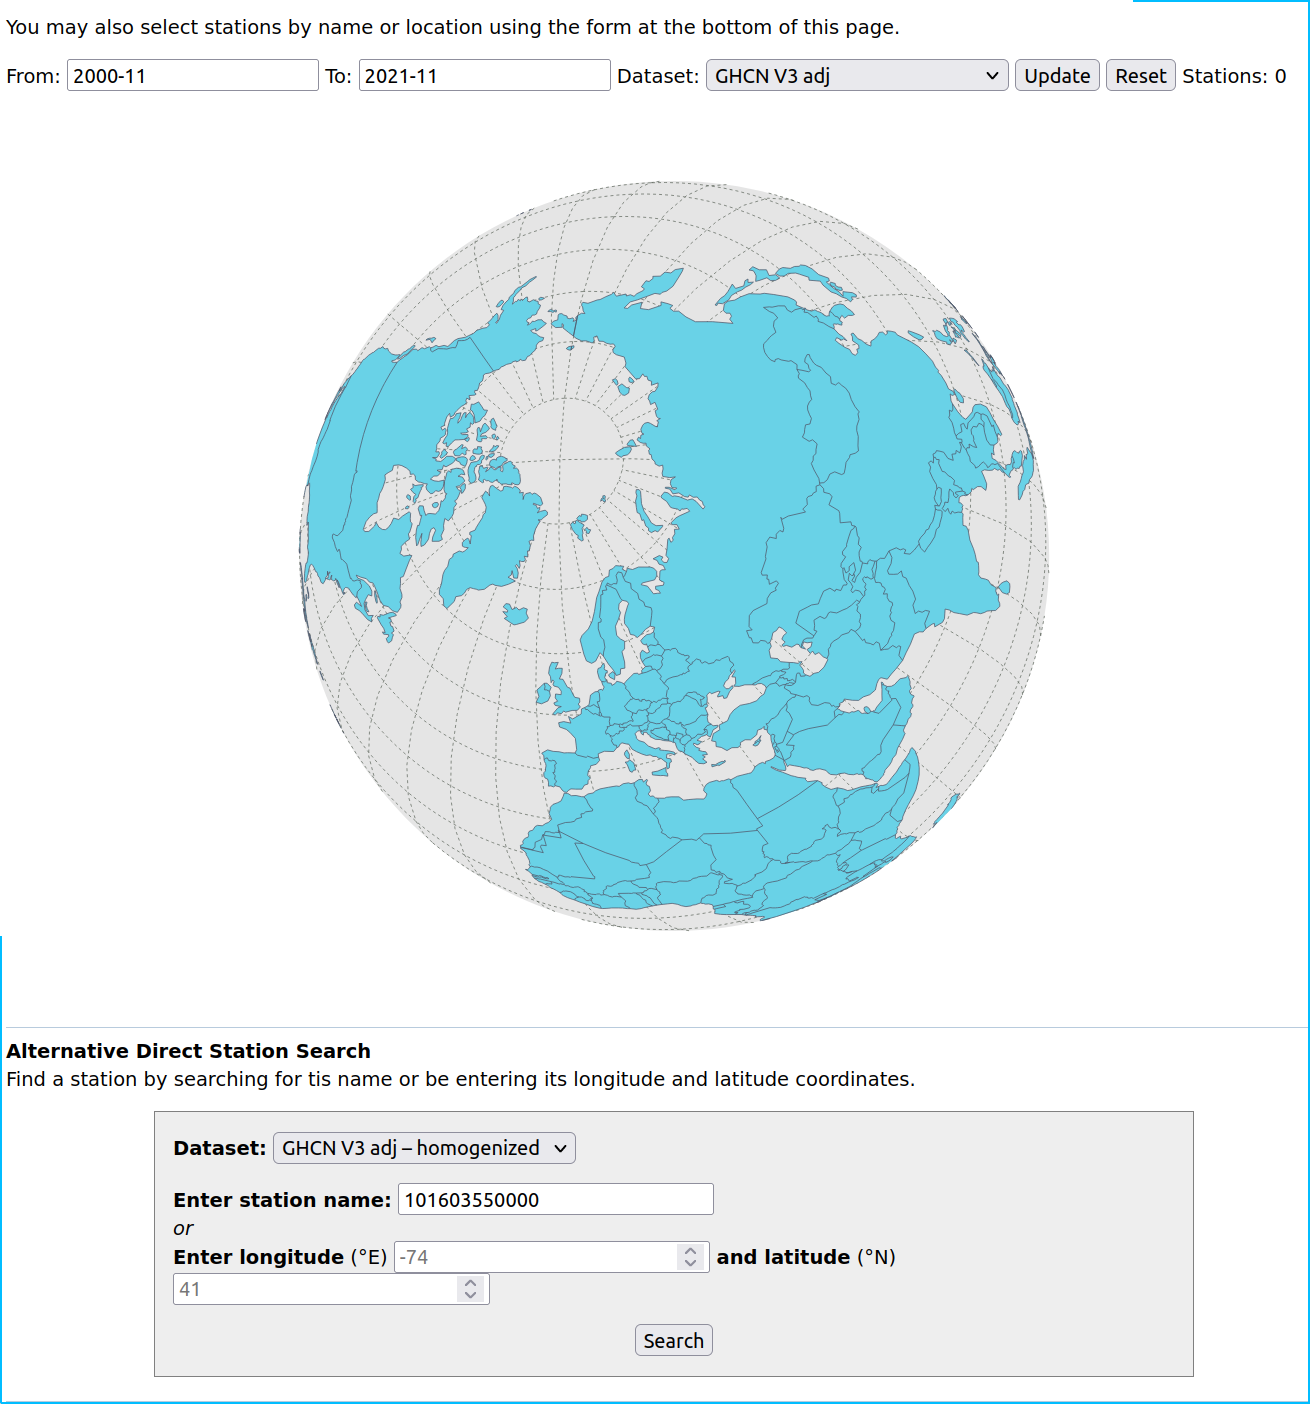
There is currently a new page with a “version 4 dataset” here. This is how it currently looks like:


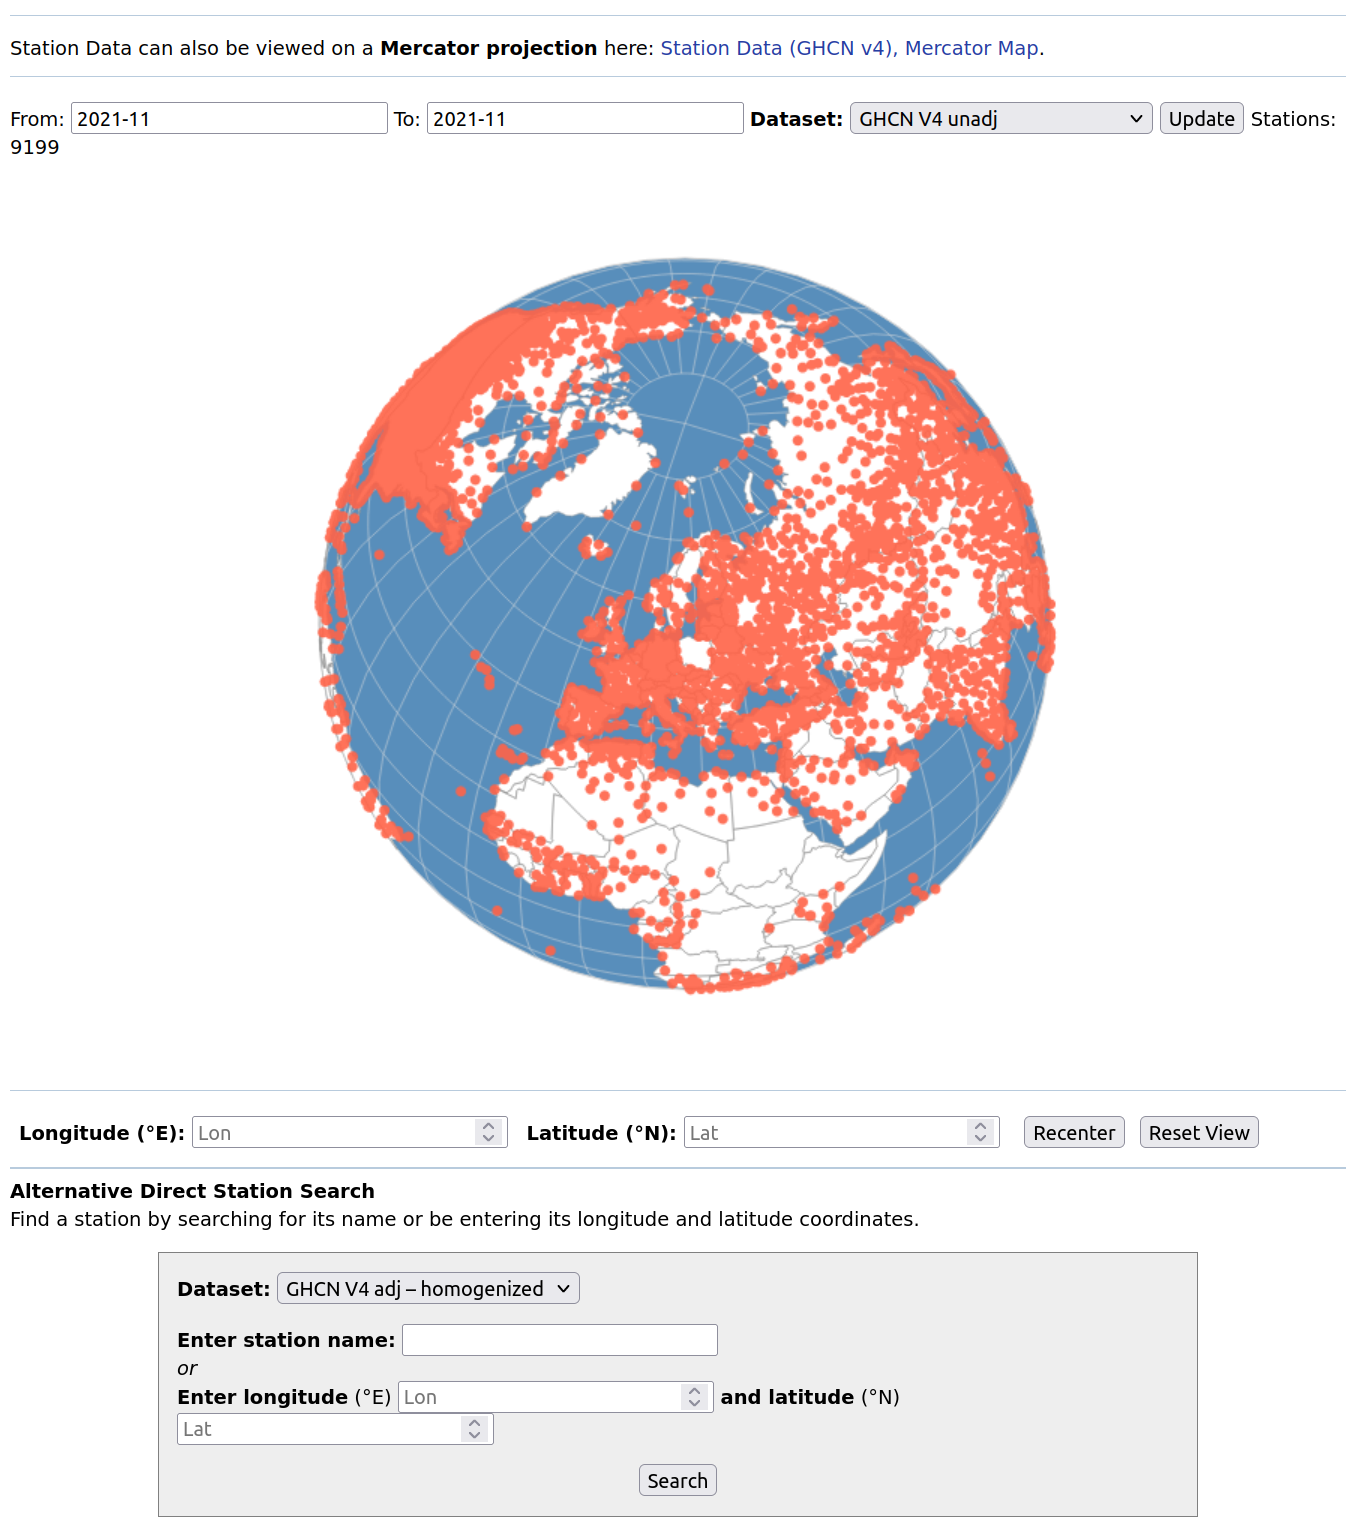
Apriori this looks as if most of the stations are “back on track” but then I couldn’t find out within a decent time how much of this data is “reconstructed” in the sense of “educated guess” and how much is actual data from the respective stations. Another thing that caught my attention was that the content of the tooltipmenu of each station is partially non accessible, I don’t remember whether this is a new phenomenon.

Employment to population ratio

Wednesday, July 23rd, 2014

I am still collecting data on global employment in order to better investigate the replacement of human work by machines. Unfortunately it turned out that the International Labour Organisation (ILO), which holds most of the original data restructured their IT-sector. This means in particular that some older data can’t be reproduced any more. Above you can see that the worldwide employment went down on average since the nineties. I keep the data now here locally on our account as a copy from ILO in order to keep the findings reproducible. The data source as well as the source code for extracting it (GPL) are here. As always: if you spot some mistakes please let me know.

Periodicity

Sunday, June 22nd, 2014

This concerns a discussion on Azimuth. I found that the temperature anomaly curve, which describes the global combined land [CRUTEM4] and marine [sea surface temperature (SST)] temperature anomalies (an anomaly is a deviation from a mean temperature) over time (HADCRUT4-GL) has a two-year periodicity (for more details click here). The dots in the above image shall display, why I think so. The dark line drawn over the jagged anomaly curve is the mean curve. The grey strips are one year in width. A dot highlights a peak (or at least an upward bump) in the mean curve. More precisely there are:

18 red dots which describe peaks within grey 2-year interval
5 yellow dots which describe peaks out of grey 2-year interval
(two yellow peaks are rather close together)
1 uncolored dot which describes no real peak, but just a bump
4 blue dots which describe small peaks within ditches

One sees that the red and yellow dots describe more or less all peaks in the curve (the blue dots care about the minor peaks, and there is just one bump, which is not a full peak). The fact that the majority of the red and yellow dots is red, means that there is a peak every 2 years, with a certain unpreciseness which is indicated by the width of the interval.

Upon writing this post I saw that I forgot one red dot. Can you spot where?

Especially after doing this visualization this periodicity appears to me meanwhile so visible that I think this should be a widely known phenomenom, however at Azimuth nobody has heard yet about it. If its not a bug then I could imagine that it could at least partially be due to differences in the solar irradiance for northern and southern hemissphere, but this is sofar just a wild guess and would need further investigations, which would cost me a lot of (unpaid) time and brain. So if you know how this phenomen is called then please drop a line. If its not a bug then this phenomen appears to me as an important fact which may amongst others enter the explanation for El Niño.

gamification for secret services

Thursday, June 19th, 2014


“In flagranti”, image from the art series “detective stories” by Massimo Mascarpone

This is just a a very brief follow-up to my last post in which I was looking at the market sizes of virtual assets.

techdirt has a blog post in which it is described that apparently the NSA uses gamification for making the use of the XKeyscore system more appealing.

I guess although here a game is used as an introduction for a virtual application this type of game wouldn’t fall into the free-to-play category, from superdataresearch:

One important trend in this context is the emergence of free-to-play or virtual goods revenue model. It allows the next generation of gamers to try a game before they commit any money, offering them a smooth introduction to games rather than asking for $50-$60 at the door.

Aimbottleneck

Tuesday, April 8th, 2014


Title: “Kreative Mode beim Bedrockabgrundste-in”, oil on canvas, artist: Mudda Prahler

There was recently a post on Gamasutra with the title: Titanfall: Why Respawn is punishing cheaters. The computer game Titanfall is a First person shooter that can be played with a couple of people in one environment. Wikipedia describes it as follows:

Players fight either on foot as free-running “Pilots” or inside agile mech-style walkers called “Titans” to complete team-based objectives[2][3] on a derelict and war-torn planet[4] as either the Interstellar Manufacturing Corporation (IMC) or the Militia.[5]

I don’t know Titanfall (In general I have been playing first person shooters rather rarely) but what apparently happened was that there where too many people cheating in the game.

In the post it isn’t really described what exactly is implied by cheating, but what I refer from the “punishment” announcement, I think what was happening was that some people used game bots and in particular socalled aimbots, which are software solutions which make shooting easier in such a game. From the Titanfall announcement:

You can play with other banned players in something that will resemble the Wimbledon of aimbot contests. Hopefully the aimbot cheat you paid for really is the best, or these all-cheater matches could be frustrating for you. Good luck.

I was asking myself though wether this action is part of some viral marketing campaign. That is that some cheaters could think that it could be way cooler to “win the Wimbledon of aimbot contests” rather than the usual game. Given that Titanfall had however performance problems which as it seems where due to overloaded game servers and connections, it doesn’t though look as if this would improve with aimbot contests.

In this context:

In a citation about a report by a tech- and investment-advisory firm in the time article: The Surprisingly Large Energy Footprint of the Digital Economy

In his report, Mills estimates that the ICT system now uses 1,500 terawatt-hours of power per year. That’s about 10% of the world’s total electricity generation

The New York times article: Power, Pollution and the Internet remarks the following about e.g. US data centers:

Nationwide, data centers used about 76 billion kilowatt-hours in 2010, or roughly 2 percent of all electricity used in the country that year, based on an analysis by Jonathan G. Koomey, a research fellow at Stanford University who has been studying data center energy use for more than a decade. DatacenterDynamics, a London-based firm, derived similar figures.

A summary of the last IPCC report about climate change and global warming.

and:

In Berlin there is currently the International games week Berlin.

secret service discussion

Wednesday, March 26th, 2014


numberlock: If you find all the mines at once and in the right order you may eventually get in.

There is currently an interesting discussion about secret services and their relation to mathematicians at the mathblog n-category cafe.

Generation Z: Renoise

Sunday, February 16th, 2014

IMG_0644.JPG

For Berliners and those who can afford to go to Berlin for a quick trip I would like to mention an absolute must see exhibition, namely the exhibition Generation Z: Renoise about the russian musical avantgarde in the 20s and later which is curated by L. Pchelkina, A. Smirnov, P. Aidu, K. Dudakov-Kashuro and E. Vorobyeva. The exhibition is unfortunately not as highly promoted as it should – given how fabulous it is! I hope that this post makes some more people visit it. It is definitely worth it! The exhibition is in the Künstlerhaus Bethanien, Kunstraum (unfortunately not so easy to find), it runs until Feb.23, 2014. It is free of entrance and open from 12:00-19:00 o clock.

The exhibition has the themes: Projectionism and Radio-ear, Revasavr, GIMN Institute, Theremin, Graphical Sound, Industrial Noise Machines, Amateur Noise Instruments and Destruction of Utopia. Below is a small excerpt from the respective themes. A lot of details can also be found in Andrei Smirnov’s book “Sound in Z“.

(more…)

against mass surveillance

Tuesday, February 11th, 2014

Today is The Day We Fight Back against mass surveillance. “Fighting back” means here that you may endorse the rather sound formulated International Principles on the Application of Human Rights to Communications Surveillance like by leaving your name and email adress and/or that you may display a banner on your website as a sign of your disagreement with mass surveillance.

-> related: randform article on surveillance

comment to 10 Misconceptions about free will

Saturday, January 4th, 2014


alcohol may alter brain states

For those who are interested there is a discussion about determinism and freedom, free will, privacy etc. at the blog backreaction following a post with the title: 10 Misconceptions about free will, which I found problematic. If you want to know more you may read my comment also after the klick.

(more…)

Surveillance surfing

Tuesday, December 3rd, 2013


Glowlum tapping along a dull wire, artwork by Hucky Finn, oil on canvas, inspired by a photography by Baertels, www.plainpicture.com.

There have been quite some discussions here in Germany about the revelations about the surveillance of ordinary citizens and the protection of ordinary citizens data in general.

(more…)