Modische Maschen aus Marzahn-Hellersdorf
Wednesday, June 10th, 2015 Announcement on the door of Marie e.V.
randformblog on math, physics, art, and design |
Announcement on the door of Marie e.V.


We here at randform are superexcited to present our first reader randform mega contest – simply called LeContest !!
Unfortunately our temperature visualization from last post is currently not running anymore. Probable reason: It currently seems that WebGl Earth has moved two library files. In particular the WebGl earth API base script which we were thinking was self-contained unfortunately doesn’t seem to be self-contained. We are going to look at this trouble in the near future.
supplement 05.10.2014: The interactive visualization is currently working again. Klokan technologies had responded and promised to look into this problem.
Tim and me are currently working on a interactive browser visualization using temperature data from HADCRUT, namely the CRUTEM 4 temperature station data which we map with the help of the open source web GL earth API (which seems to be to quite some extend the work of the Czech-Swiss company Klokan technologies) onto a model of the earth (covered with open street maps).
The visualization is still work in progress, but what is already visible is that the temperature data is quite deteriorating (please see also the previous randform post on the topic of deteriorization of data). Where it looks as if the deterioration had been bigger in the years from 2000-2009 than in the years 1980-2000. Below you can see screenshots of various regions of the world for the month of January for the years 1980, 2000 and 2009. The color of a rectangle indicates the (monthly) temperature value for the respective station (the station is represented by a rectangle around its coordinates) which is encoded with the usual hue encoding (blue is cold, red is hot). Black rectangles are invalid data. The CRUTEM 4 data file contains the data of 4634 stations. Mapping all the station data makes the visualization very slow, especially for scaling, therefore the slightly different scalings/views for each region and the fact that screenshots are on display. The interactive application will probably be not for all stations at once.
North America:

Jan 1980

Jan 2000

Jan 2009
Africa:

Jan 1980

Jan 2000

Jan 2009
Asia:

Jan 1980

Jan 2000

Jan 2009
Eurasia/Northern Africa:

Jan 1980

Jan 2000

Jan 2009
Northpole:

Jan 1980

Jan 2000

Jan 2009
update June 15, 2019:
There is now a similar interactive visualization at NASA for the GHCN data set at https://data.giss.nasa.gov/gistemp/stdata/
update December 29, 2021:
The link to our interactive temperature visualization, which was announced above in the post is here, the corresponding post about it is here.
The GHCN page linked on June 15, 2019 doesn’t show any station data anymore:
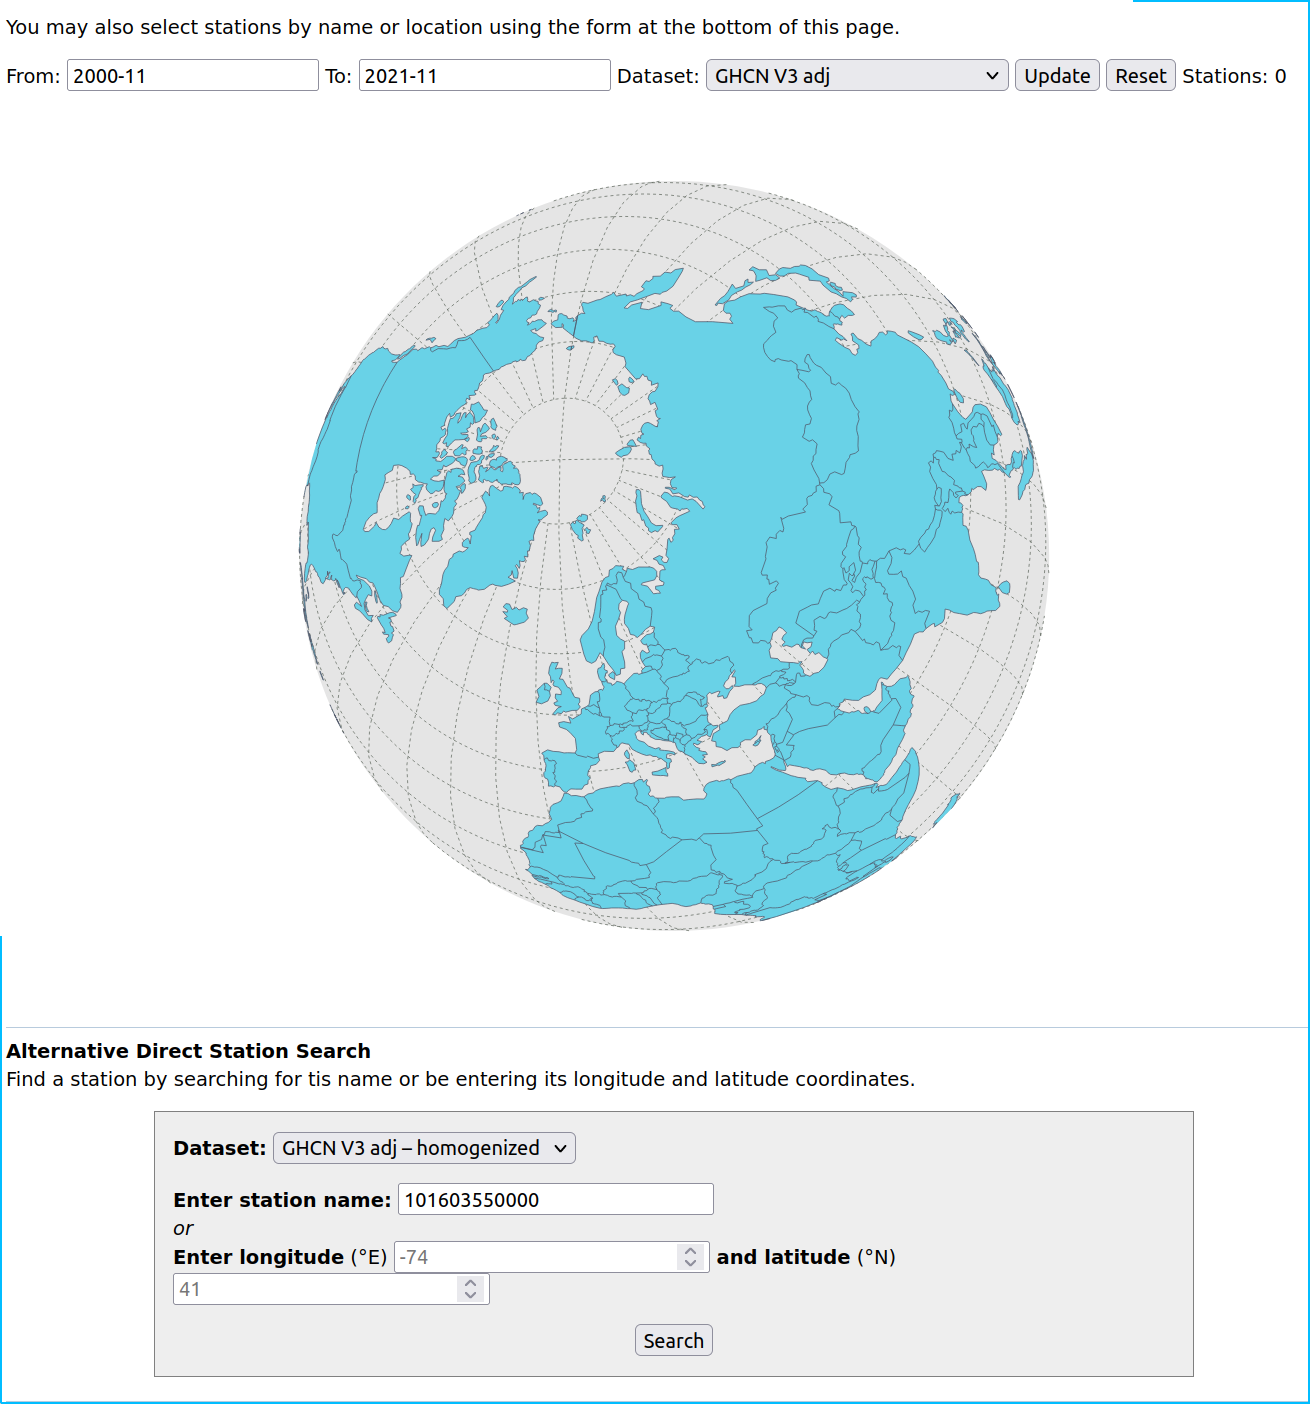
There is currently a new page with a “version 4 dataset” here. This is how it currently looks like:
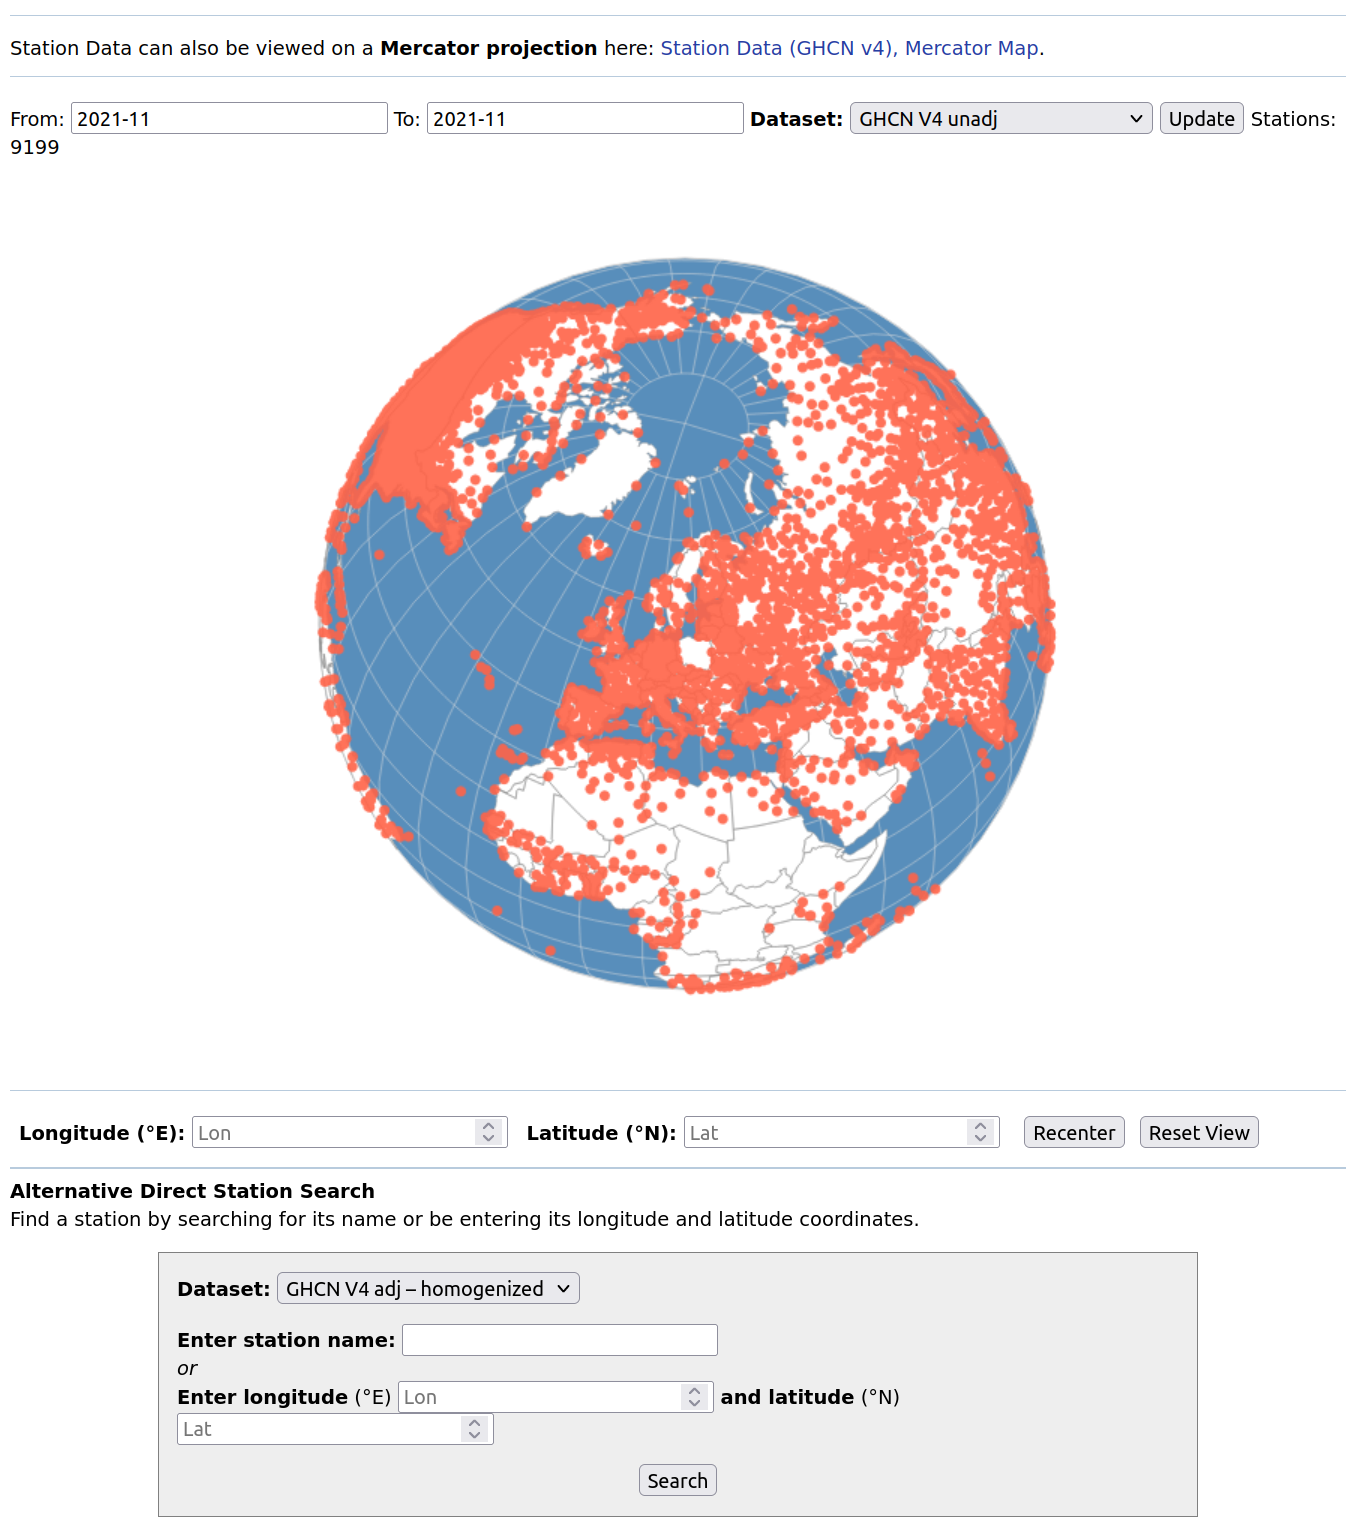
Apriori this looks as if most of the stations are “back on track” but then I couldn’t find out within a decent time how much of this data is “reconstructed” in the sense of “educated guess” and how much is actual data from the respective stations. Another thing that caught my attention was that the content of the tooltipmenu of each station is partially non accessible, I don’t remember whether this is a new phenomenon.

Title: “Kreative Mode beim Bedrockabgrundste-in”, oil on canvas, artist: Mudda Prahler
There was recently a post on Gamasutra with the title: Titanfall: Why Respawn is punishing cheaters. The computer game Titanfall is a First person shooter that can be played with a couple of people in one environment. Wikipedia describes it as follows:
Players fight either on foot as free-running “Pilots” or inside agile mech-style walkers called “Titans” to complete team-based objectives[2][3] on a derelict and war-torn planet[4] as either the Interstellar Manufacturing Corporation (IMC) or the Militia.[5]
I don’t know Titanfall (In general I have been playing first person shooters rather rarely) but what apparently happened was that there where too many people cheating in the game.
In the post it isn’t really described what exactly is implied by cheating, but what I refer from the “punishment” announcement, I think what was happening was that some people used game bots and in particular socalled aimbots, which are software solutions which make shooting easier in such a game. From the Titanfall announcement:
You can play with other banned players in something that will resemble the Wimbledon of aimbot contests. Hopefully the aimbot cheat you paid for really is the best, or these all-cheater matches could be frustrating for you. Good luck.
I was asking myself though wether this action is part of some viral marketing campaign. That is that some cheaters could think that it could be way cooler to “win the Wimbledon of aimbot contests” rather than the usual game. Given that Titanfall had however performance problems which as it seems where due to overloaded game servers and connections, it doesn’t though look as if this would improve with aimbot contests.
In this context:
In a citation about a report by a tech- and investment-advisory firm in the time article: The Surprisingly Large Energy Footprint of the Digital Economy
In his report, Mills estimates that the ICT system now uses 1,500 terawatt-hours of power per year. That’s about 10% of the world’s total electricity generation
The New York times article: Power, Pollution and the Internet remarks the following about e.g. US data centers:
Nationwide, data centers used about 76 billion kilowatt-hours in 2010, or roughly 2 percent of all electricity used in the country that year, based on an analysis by Jonathan G. Koomey, a research fellow at Stanford University who has been studying data center energy use for more than a decade. DatacenterDynamics, a London-based firm, derived similar figures.
A summary of the last IPCC report about climate change and global warming.
and:
In Berlin there is currently the International games week Berlin.
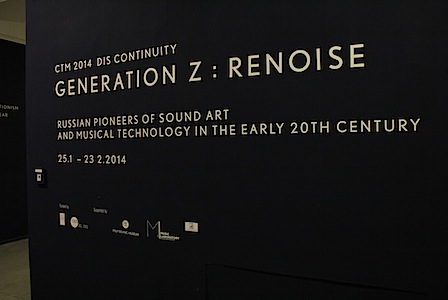
For Berliners and those who can afford to go to Berlin for a quick trip I would like to mention an absolute must see exhibition, namely the exhibition Generation Z: Renoise about the russian musical avantgarde in the 20s and later which is curated by L. Pchelkina, A. Smirnov, P. Aidu, K. Dudakov-Kashuro and E. Vorobyeva. The exhibition is unfortunately not as highly promoted as it should – given how fabulous it is! I hope that this post makes some more people visit it. It is definitely worth it! The exhibition is in the Künstlerhaus Bethanien, Kunstraum (unfortunately not so easy to find), it runs until Feb.23, 2014. It is free of entrance and open from 12:00-19:00 o clock.
The exhibition has the themes: Projectionism and Radio-ear, Revasavr, GIMN Institute, Theremin, Graphical Sound, Industrial Noise Machines, Amateur Noise Instruments and Destruction of Utopia. Below is a small excerpt from the respective themes. A lot of details can also be found in Andrei Smirnov’s book “Sound in Z“.
A new video of one of Tims recent music projects (a video about the ladder filter is here). In the video he explains the construction of a spring reverb:
A detailed description on how to build the spring reverb can be found on the astlab page.
A soundtrack on soundcloud of how the spring reverb sounds:
Tim and a bit of his music projects will eventually appear in a new film by film maker Ekaterina Eremenko. That is we had a film team from Moscow here at home. But it is sofar not clear wether the material will be used.
Ekaterina Eremenko, who has also studied math, received recently much attention for her film colours of math (trailer) featuring amongst others the rather well-known mathematicians Cedric Villani, Anatoly Fomenko, Aaditya V. Rangan, Günter Ziegler, Maxim Kontsevitch and Jean-Michel Bismut.
I don’t know if this is a new trend but I found incidentally more recent films where features of the life of mathematicians are documented. Like at the website of the “Higher Algebra section” at Moscow State University I found interviews with V. N. Latyshev talking About academic mathematics (in russian) and about Reminiscences of A. A. Markov (in russian) made by Andrei Verovkin who features a whole series of interviews with scientists.
In this context a short note for those who are in or are planning to go to visit Berlin: There were/are currently music festivals for more modern music taking place in Berlin, which enhance the usual club life or on the more classical level regular events like e.g. the weekly series “Unerhörte Musik im BKA”. One was the Ultraschall Festival and one is the ctm festival, which is in cooperation with the festival for art and digital culture “transmediale”. The transmediale theme of this year is “afterglow:”
The conference takes afterglow as a metaphor for the present condition of digital culture, examining the geopolitical, infrastructural and bodily consequences of the excessive digitisation that has taken place over the course of the last three decades.
While updating my post about taxes in Greece and their semantic accessability, I looked at some current projects in “big data” and statistics and found an interesting application called Rapid Miner LOD Extension (I haven’t tried it though), which allows to do operations on linked open data (LOD) (see e.g. the european gateway to LOD) via the data mining program Rapid Miner.
The Rapid Miner LOD extension was amongst others used by the winners of the Semantic Statistics Challenge. The winner’s slideshare link hosts some examples, like maps which investigate the correlation between unemployment and police stations in France, which display a bit the capabilities of the involved programms and databases.
According to the notice “NBS signs data agreement with hi-tech firms” on Chinadaily there is also a lot going on in China:
The National Bureau of Statistics teamed up with 11 high-tech firms to use big data technology in the collecting, processing and analyzing of important statistics.
and
Under this partnership, the bureau and the 11 companies will co-develop a standard on how to use big data in statistics.
So it will be interesting to see wether some of this high tech data will enter the Linked open data pool and wether we will get to see soon some interesting visualizations of it.
Here you get an exclusive look behind the randform (iron ;)) curtain:
Tim’s latest free time projects were heavily located in music electronics. His last weekend project was to use a socalled x-OSC chip (which he is currently beta testing) by the british company x-io technologies (see blue blinking board in the video) as a wireless remote control for a socalled ladder filter (unfortunately a bit hard to see in the wirings on a kitchen table…).

on the attractivity of locations: refurbished buildings in Marzahn-Hellersdorf, among them the now newly renovated Rhin Towers
I have found Maxwell’s equations of human behaviour!